We have rebuilt every page of the Traffic Creator dashboard. It now shows today's visits against your plan, hour by hour, and how many days your credits will last.
Setting up a campaign now comes with a live preview. Search Console and Local SEO campaigns have real pages, and Analytics is out of beta. The new dashboard went live in late September 2026, and we have kept adding to it since.
Key takeaways
- See today's visits against your plan, hour by hour, with a marker for the current hour.
- Every credit balance shows roughly how many days it will last.
- Set up website, Search Console and Local SEO campaigns in one guided flow with a live preview.
- Search campaigns show verified clicks, hit rate and the Google position we measure every day.
- Analytics is out of beta and now includes your search campaigns.
- Every page works from a phone to a wide screen, in light and dark mode.
Why we changed the design
A dashboard has one job: tell you quickly whether your campaigns are doing what you paid for. The old dashboard grew page by page. Some pages were sales pages, and some controls did nothing.
The new design follows a few rules, and each one makes the dashboard easier to read:
- Every visitor is a dot. Charts, meters and progress bars are drawn from dots, so a column of dots is a number of visits.
- Orange means something. We use our orange only for data that matters and for the one main action on a screen.
- One big number per page. Your credit balance gets the large LED-style figure. Everything else stays calm.
- Readable for everyone. Charts never rely on colour alone, and no text is smaller than 12 pixels.
- No decoration. Numbers only move when their value changes.
The result is quieter, and it shows more. Here is everything that is new.
Overview: today comes first
The first page answers one question: is today on track?
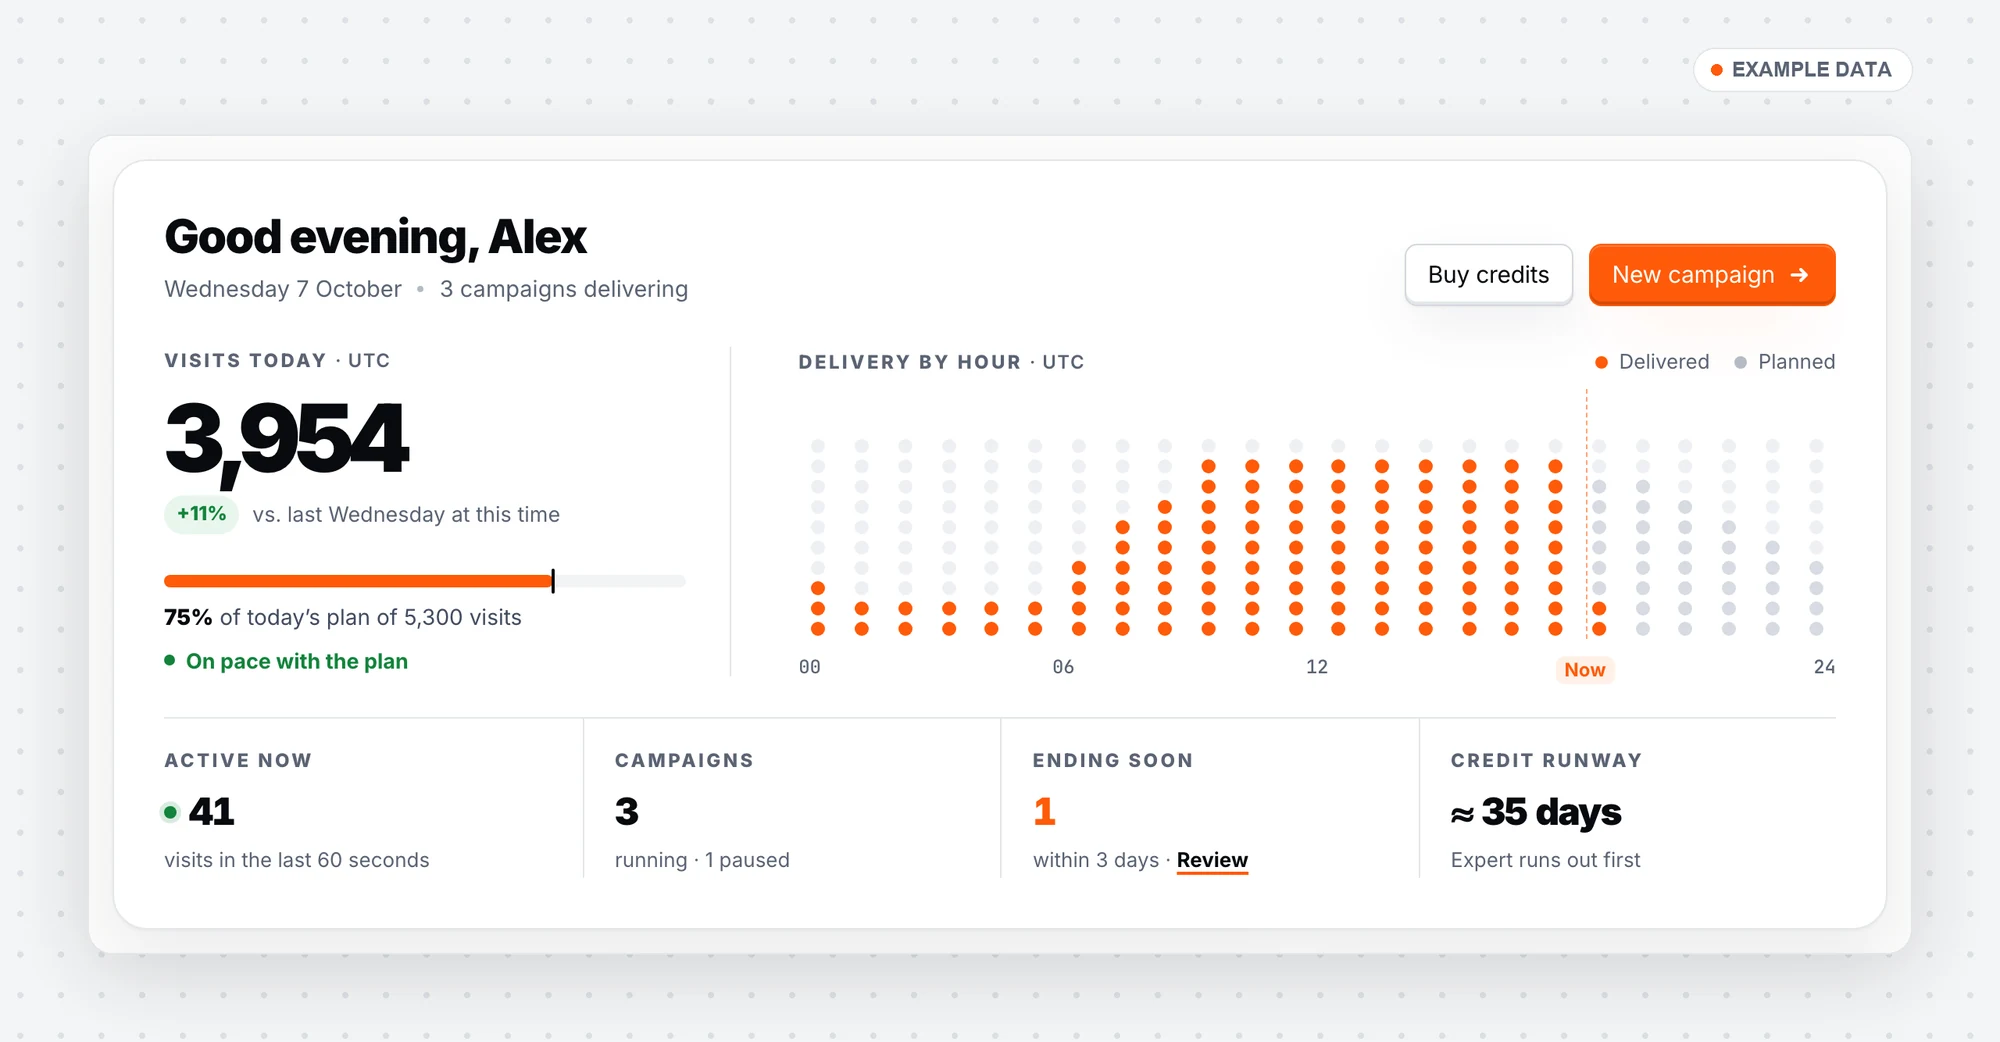
Visits today against the plan, delivery by hour, and the status strip with the credit runway.
- Visits today shows the visits delivered so far as a share of today's plan, with "On pace with the plan", ahead or behind.
- It compares today with the same weekday last week, at the same time.
- Delivery by hour draws each hour as a column of dots. Orange is delivered, grey is still planned, and "Now" marks the current hour.
- A status strip shows Active now, the visits in the last 60 seconds, and your running campaigns. It also lists campaigns Ending soon and your Credit runway: which balance runs out first.
- Credit balance lists each balance with "≈ N days left", based on today's plan.
- The 30-day chart switches between visits and page views. Next to it: your last 7 days, best day, daily average and trend.
- Top campaigns and your configured source mix complete the page. Everything refreshes every 60 seconds.
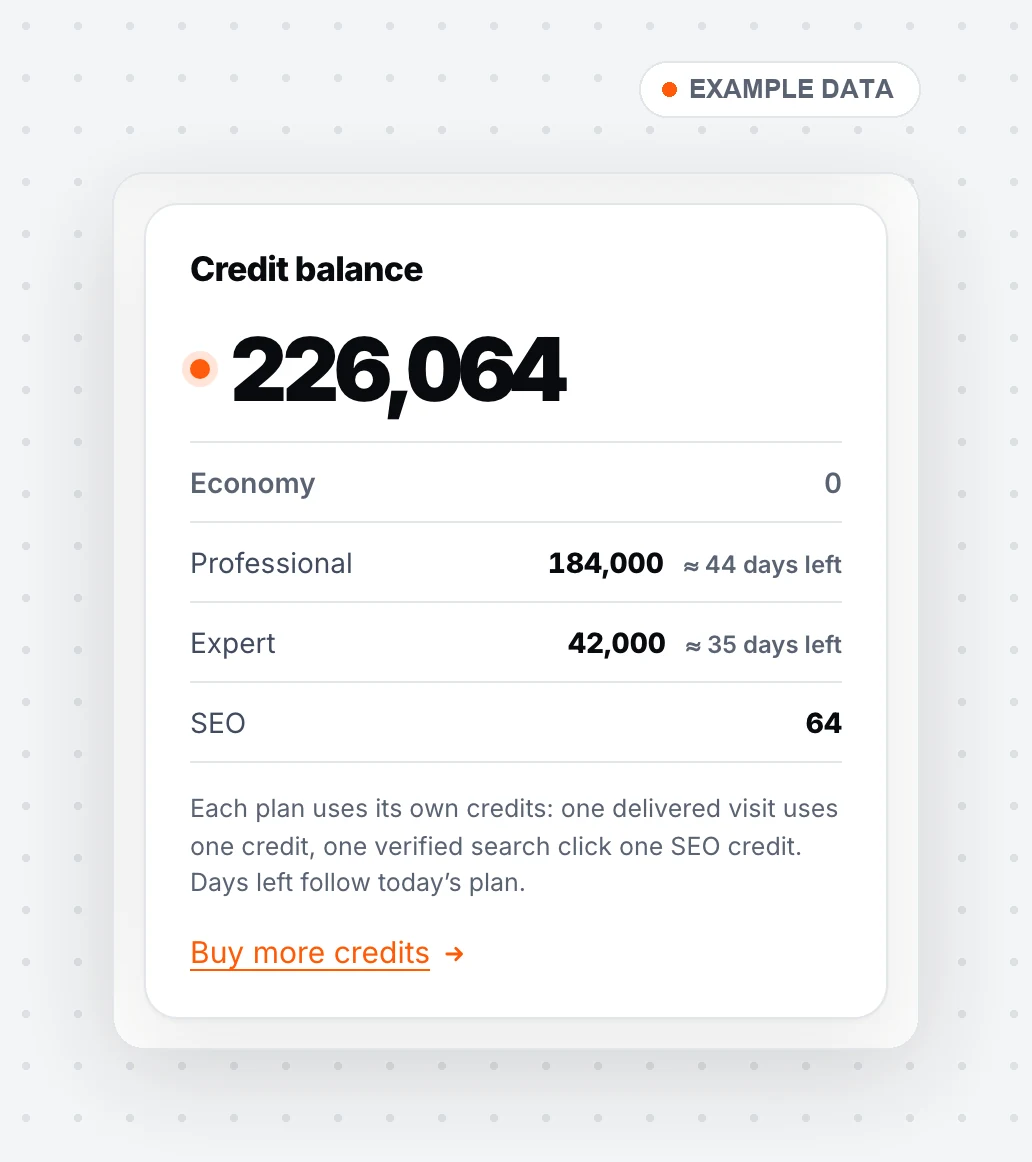
Every balance shows roughly how many days it lasts at today’s plan.
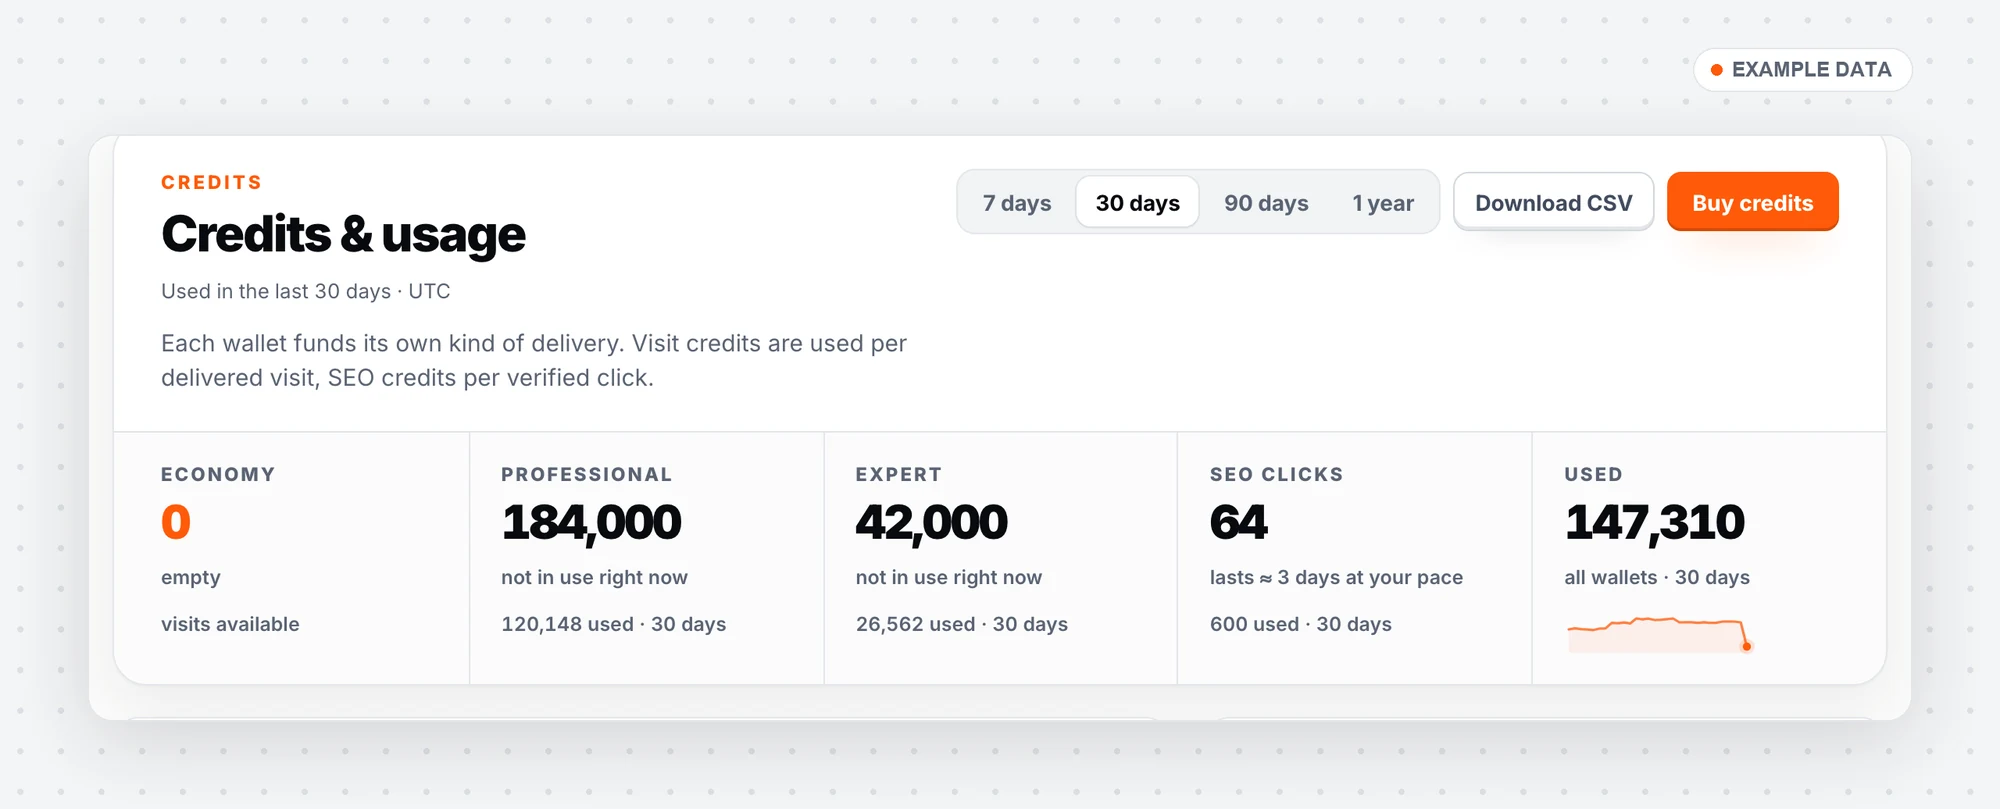
Credits & Usage shows the same for every wallet, with a CSV download.
A new way to set up campaigns
Setting up a campaign now happens in one guided flow, with a live preview next to every step.
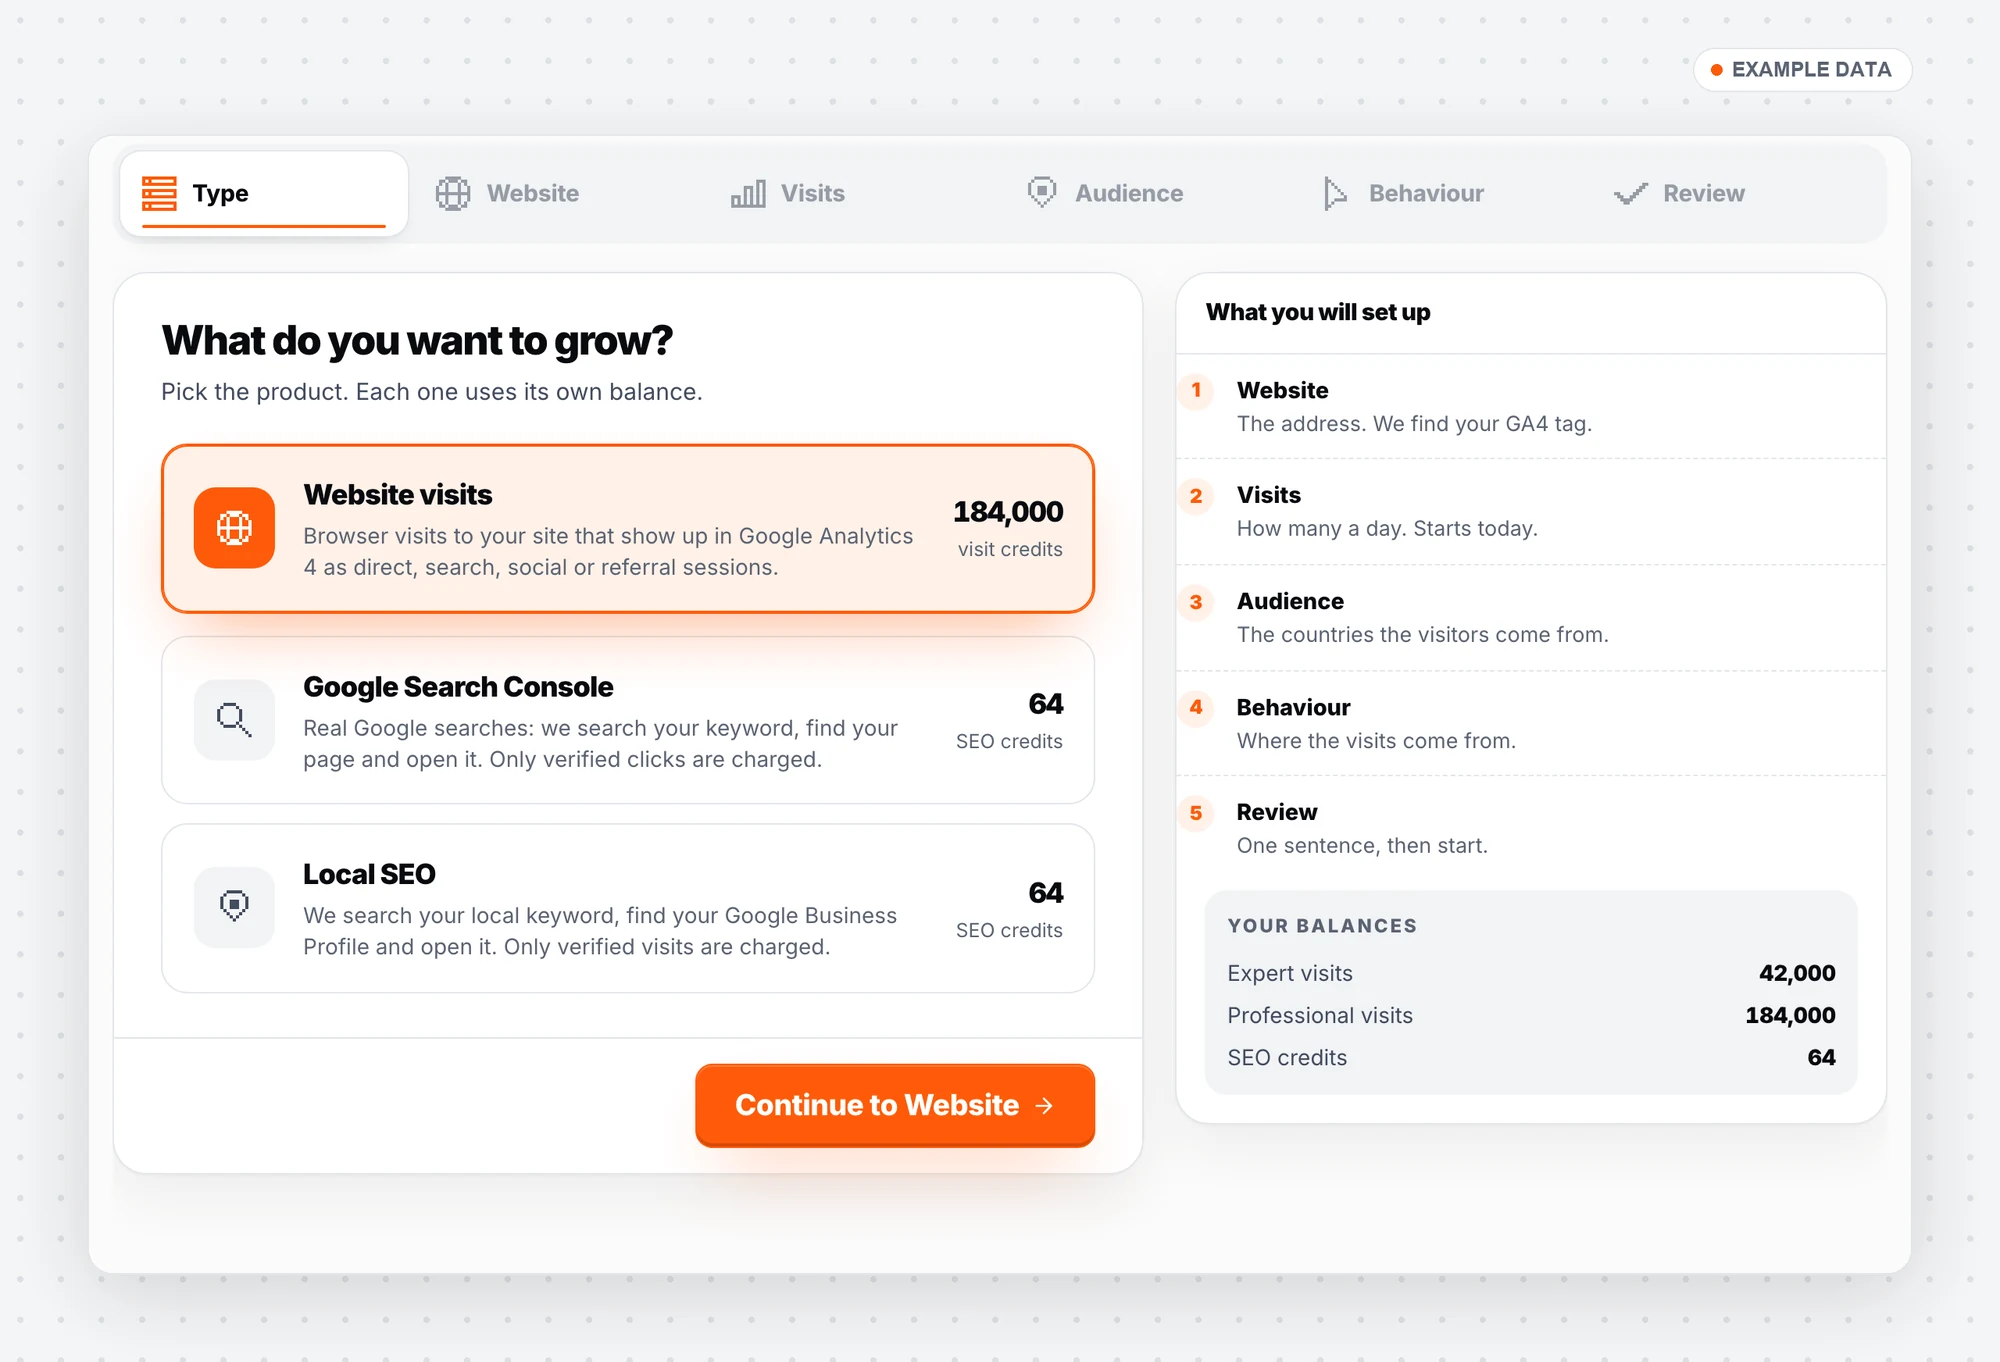
Pick what you want to grow. The right side lists what you will set up and your balances.
- Start with "What do you want to grow?" and pick Website visits, Google Search Console or Local SEO.
- Local SEO campaigns can now be created right in the dashboard.
- Type your address and we read your Google Analytics (GA4) ID from your public page. Nothing on your site changes.
- Choose how many visits a day, and see how long your balance lasts at that pace.
- Pick the countries and how visitors arrive: directly, from search engines, social media, AI assistants, referral links or messengers.
- The last step sums up the whole campaign in one sentence, with the credits it uses and how long they last.
- An unfinished campaign survives a page reload.
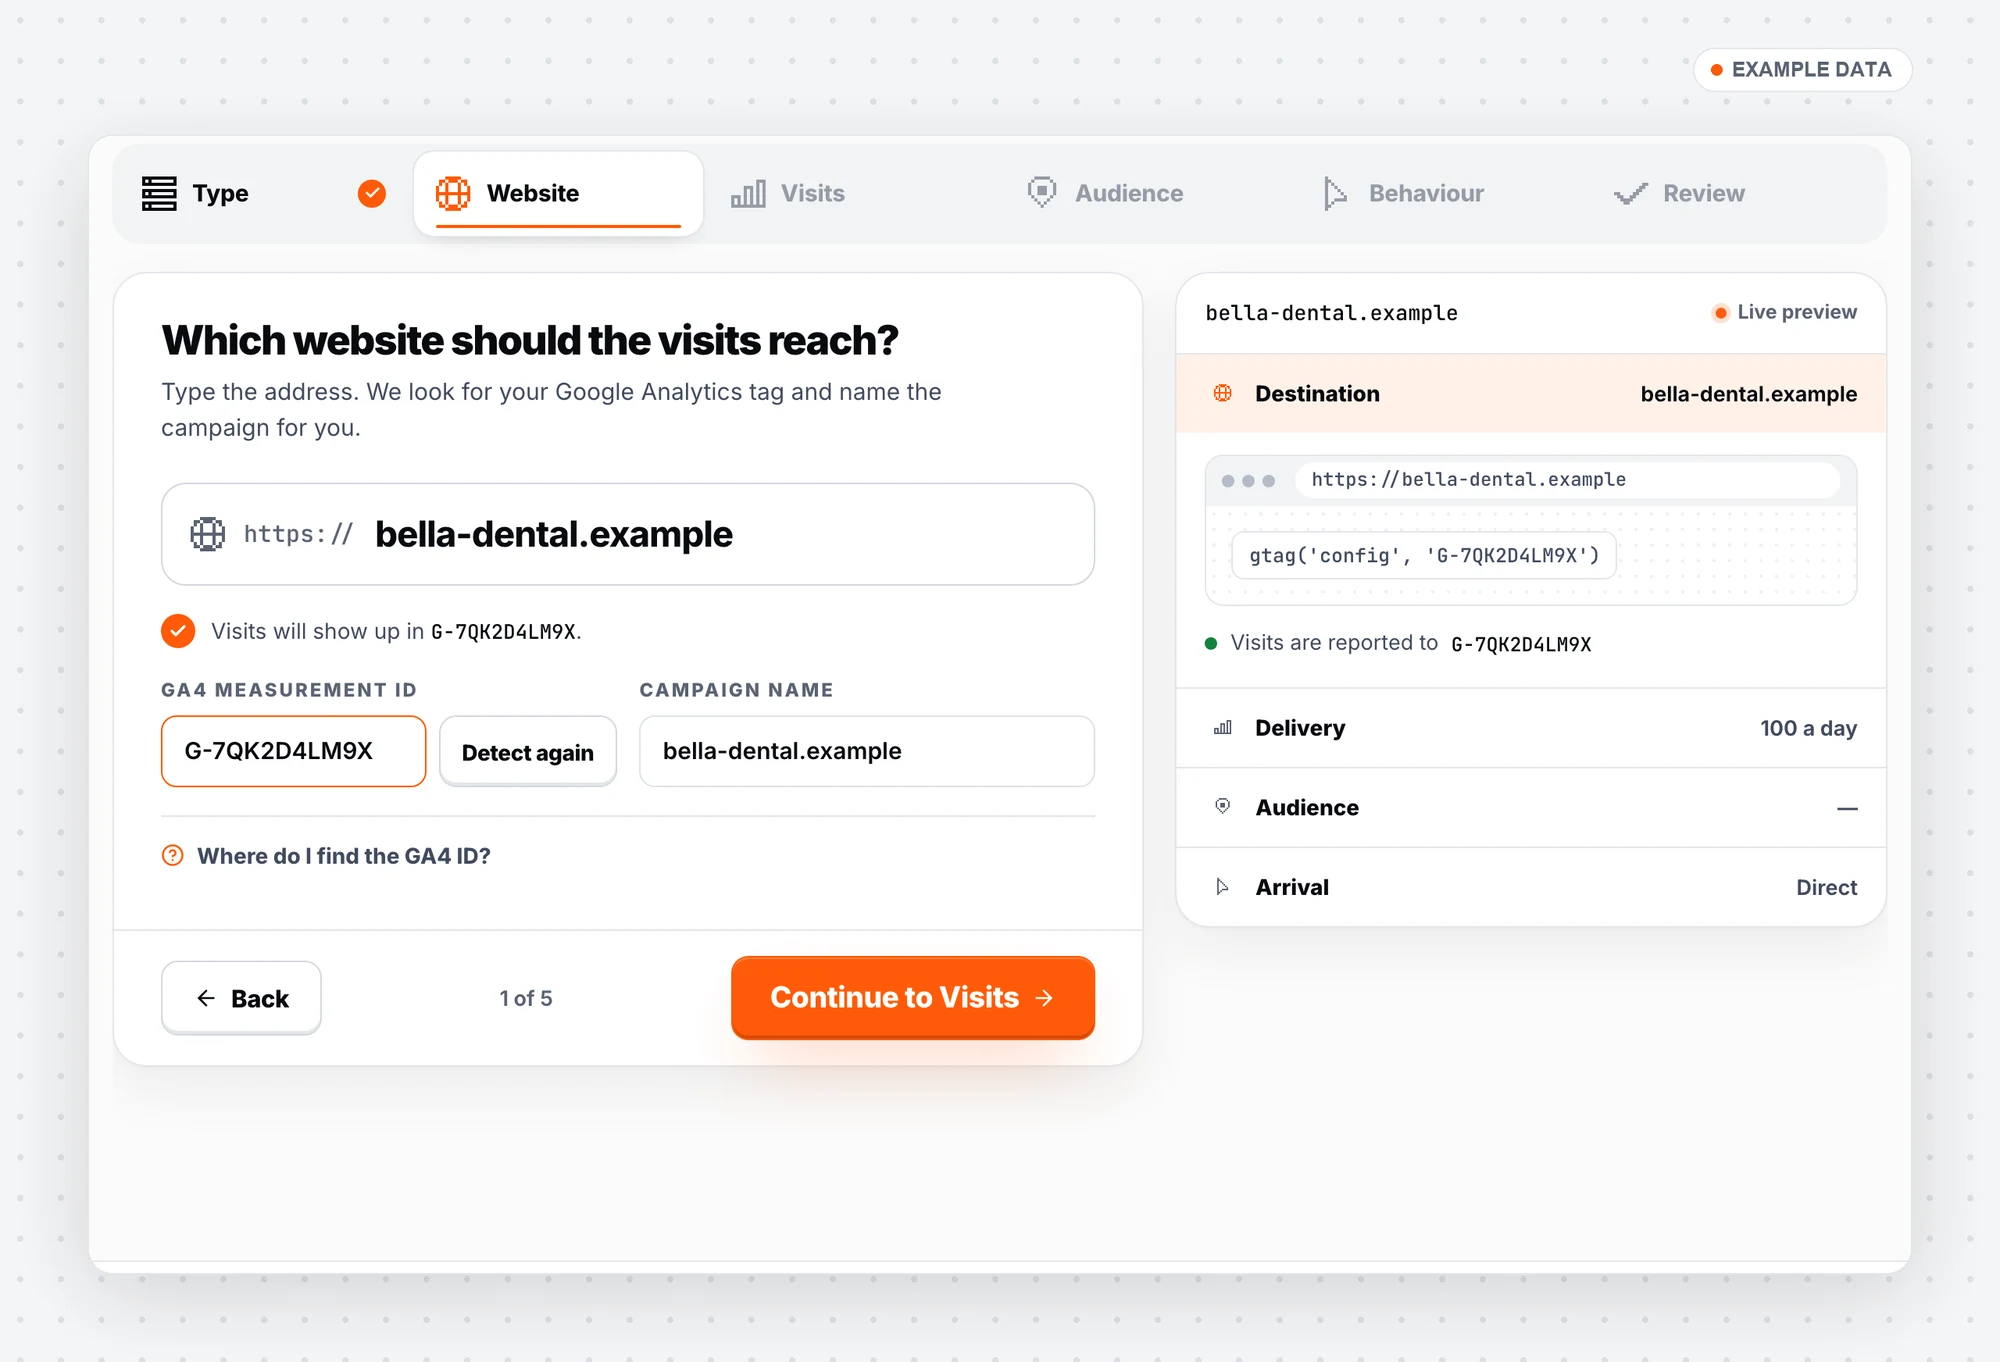
Type the address; the GA4 ID is filled in from your public page.
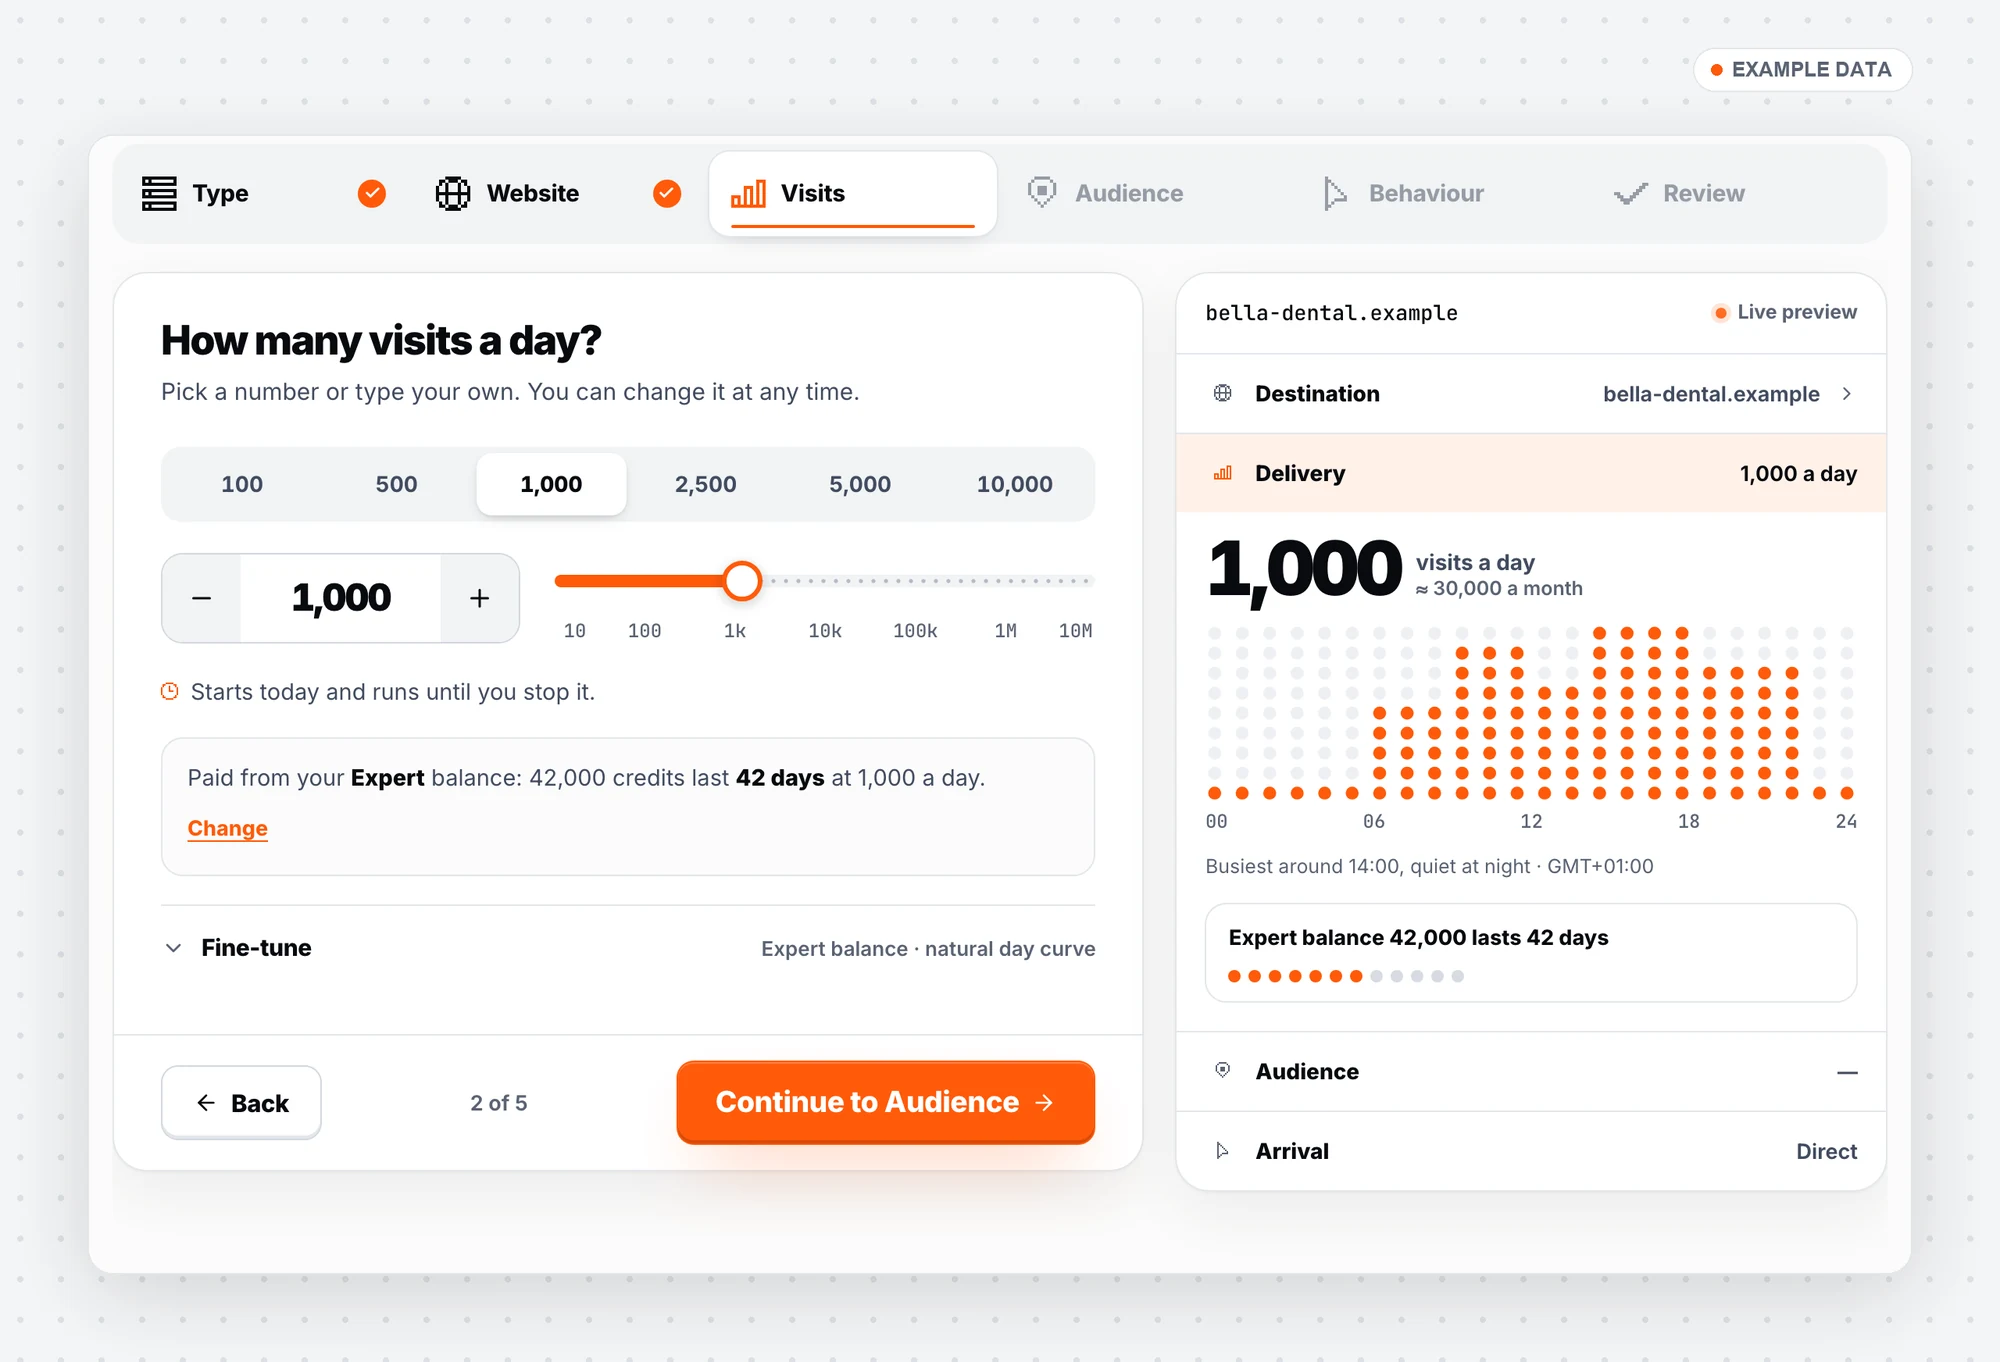
Choose visits a day and see how long your balance lasts at that pace.
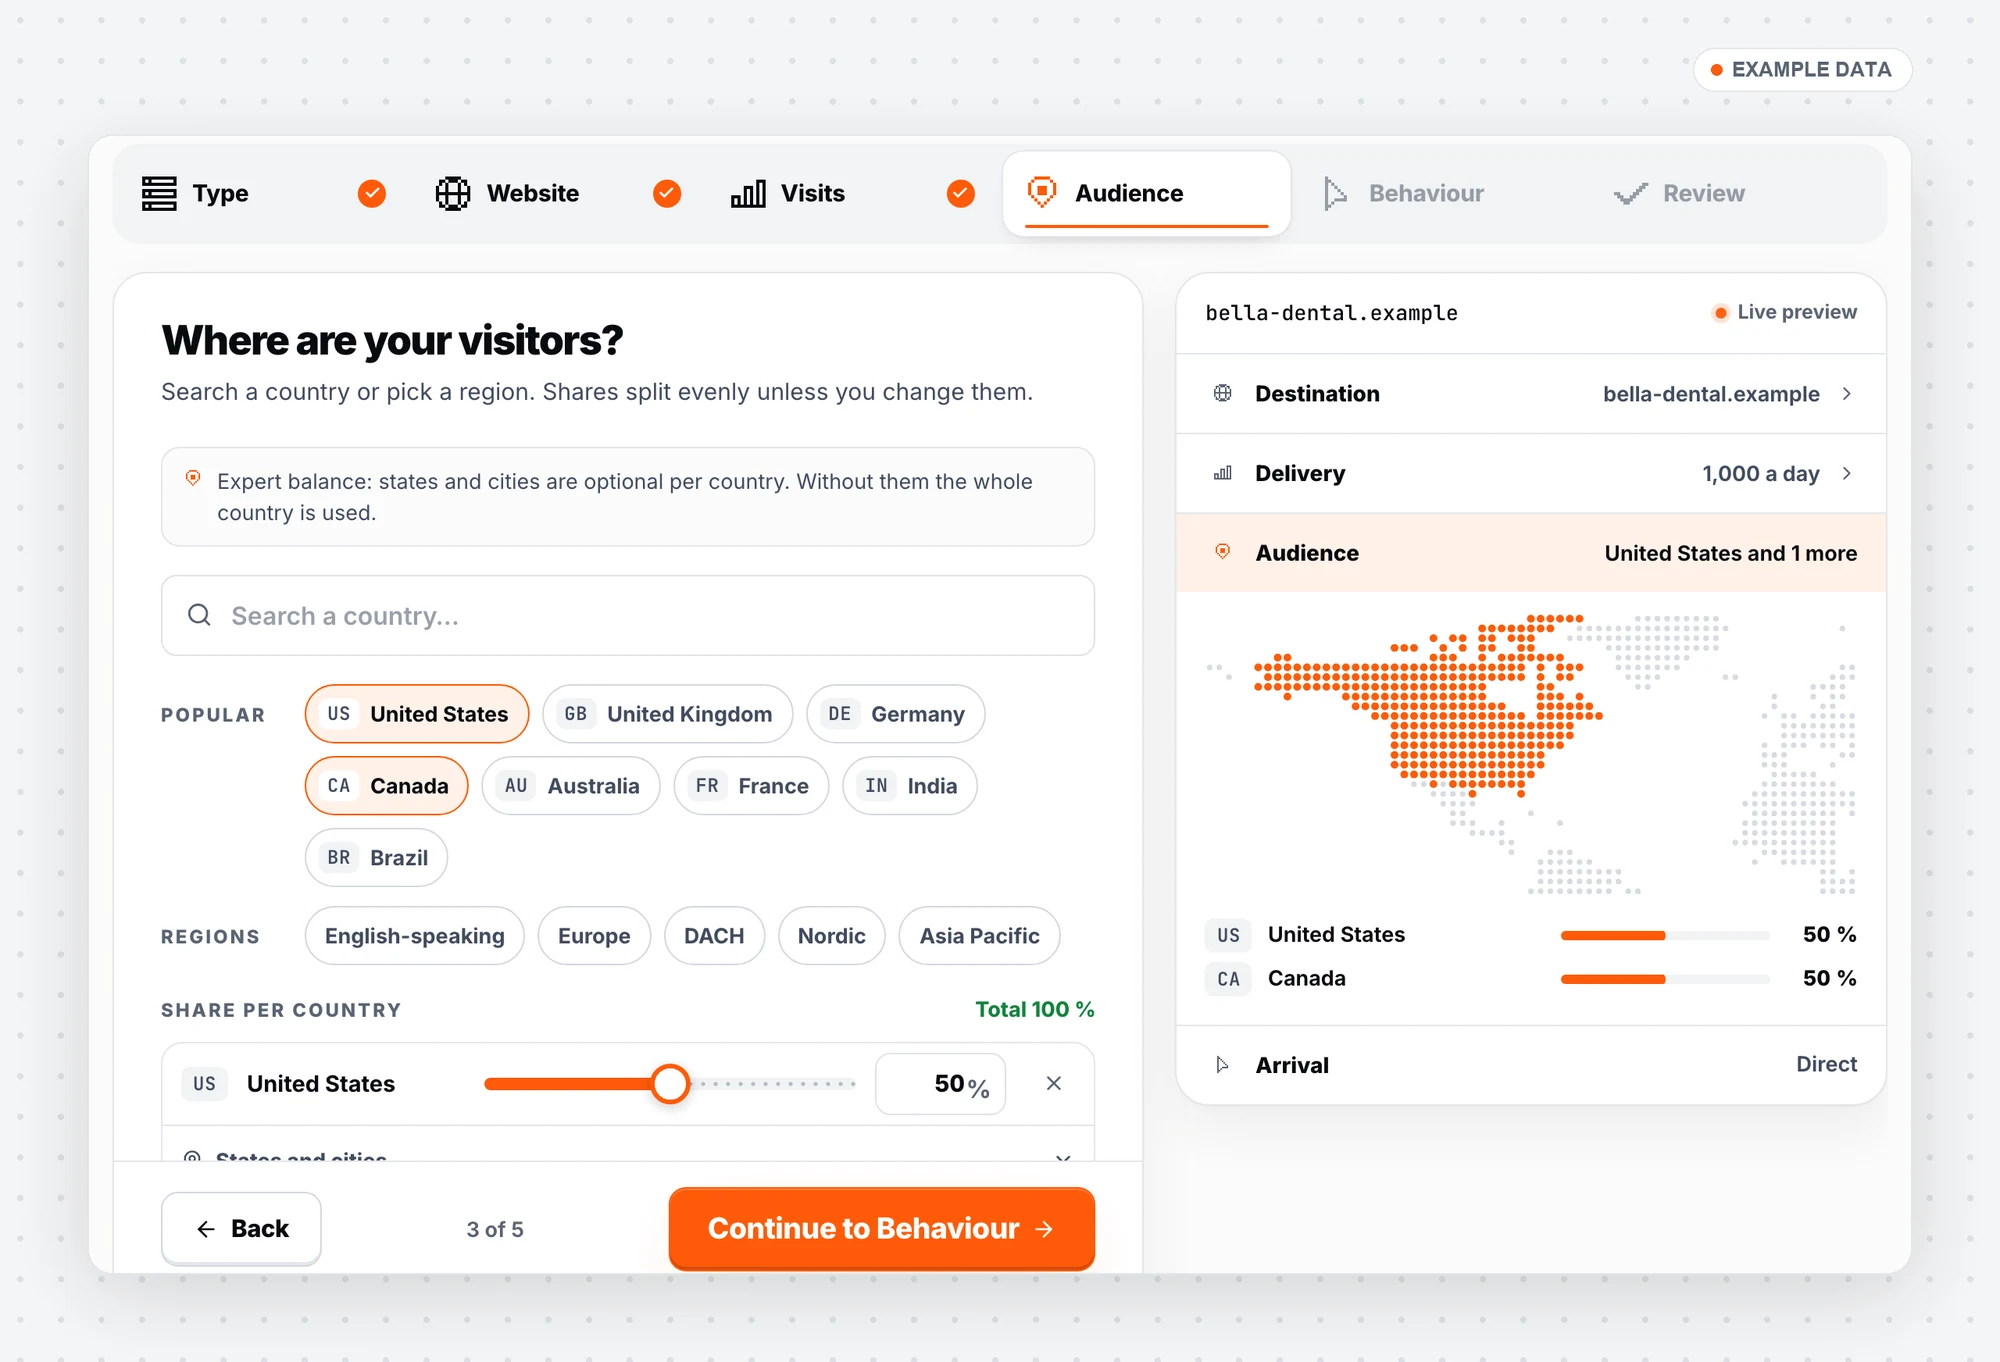
Countries light up on the map as you add them.
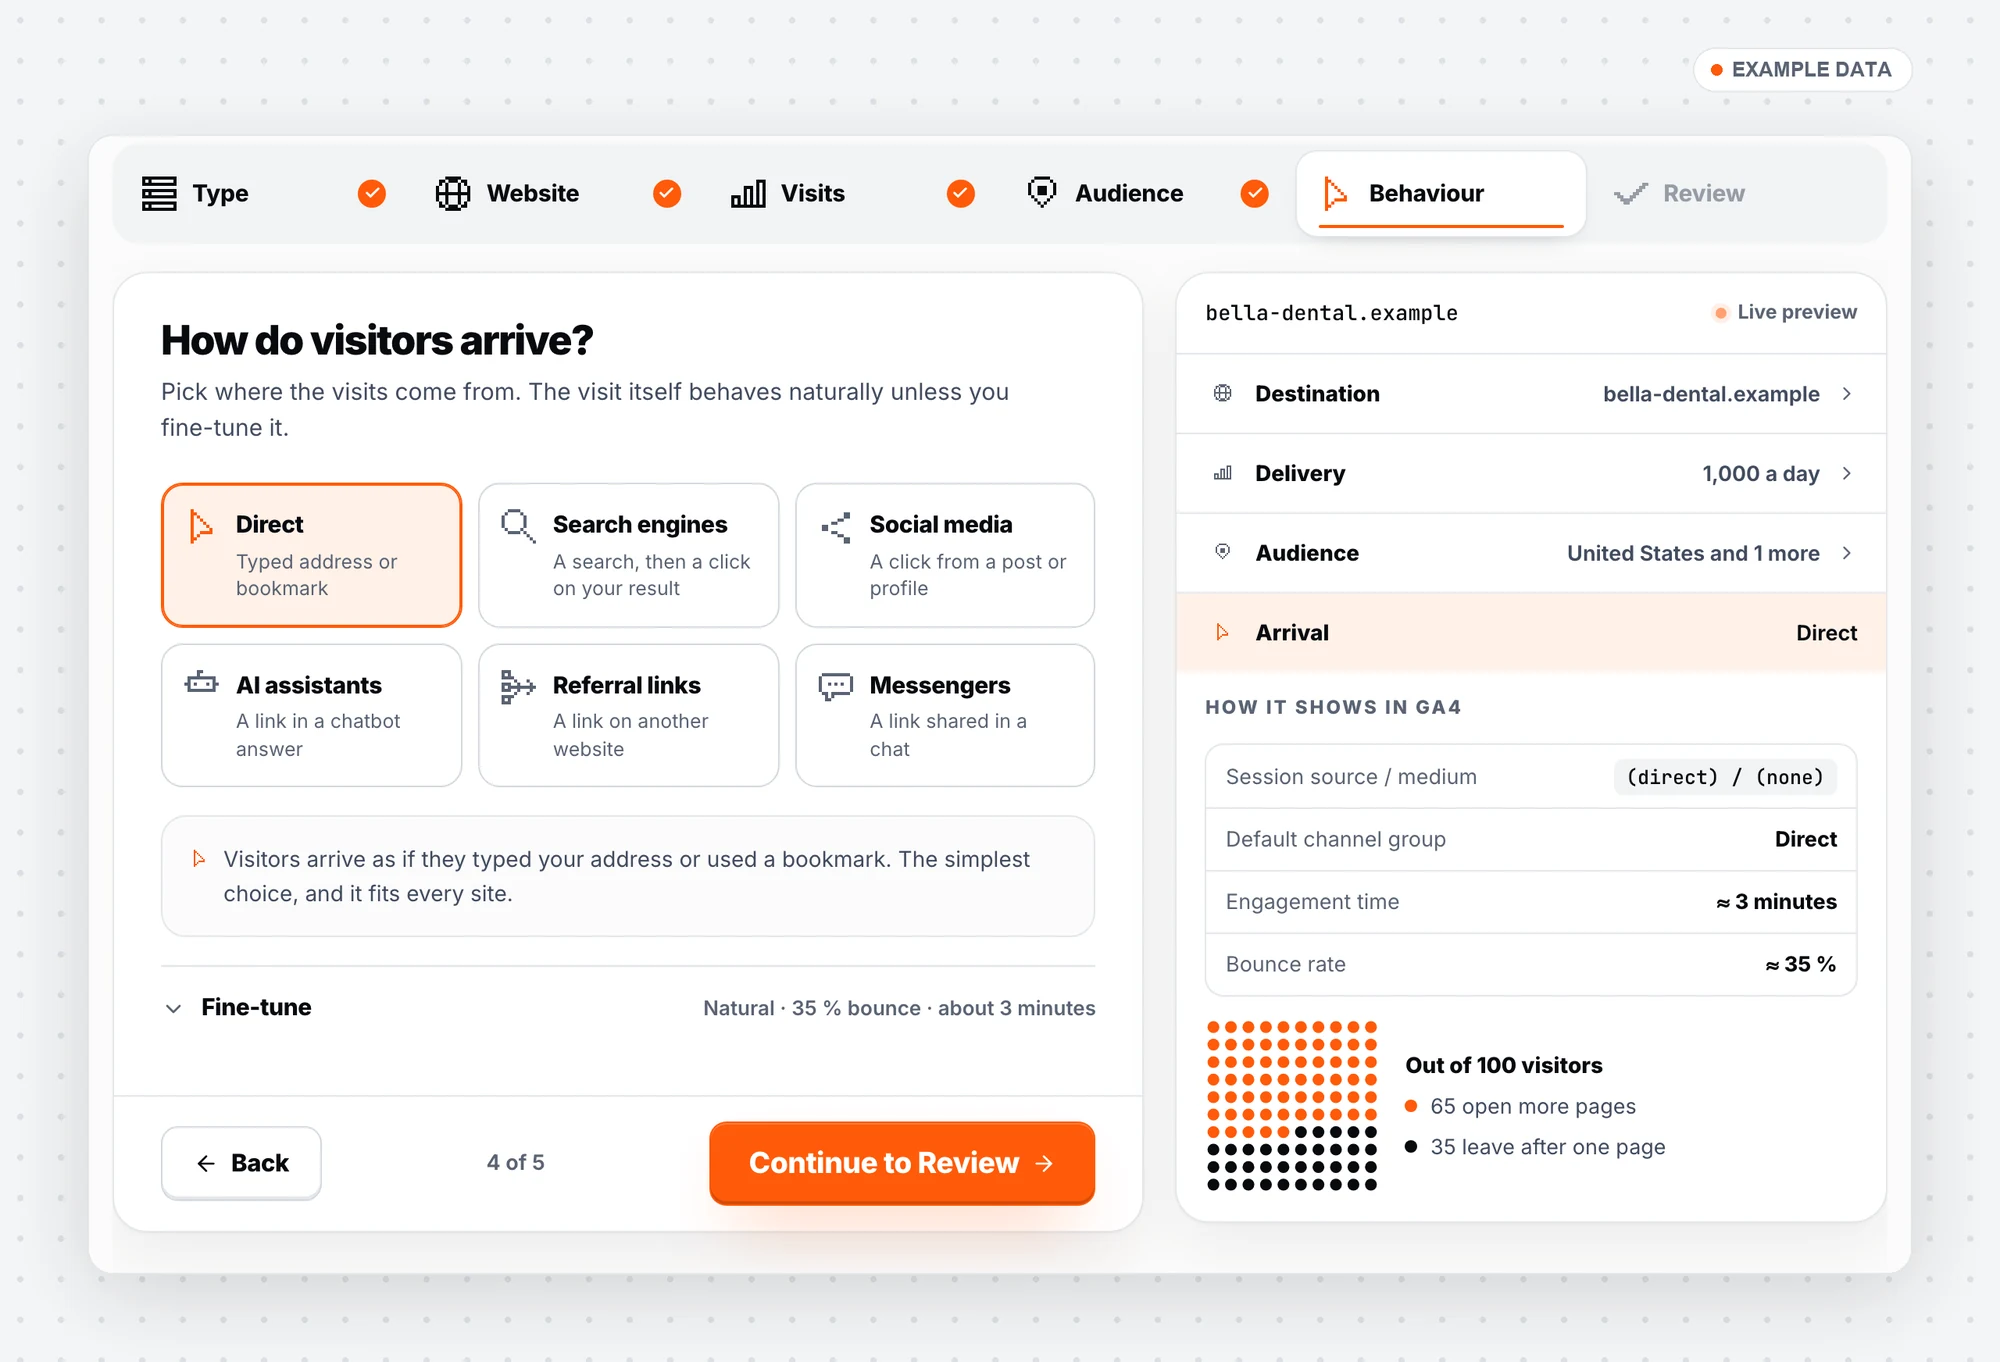
Choose how visitors arrive, and see how it will show in GA4.
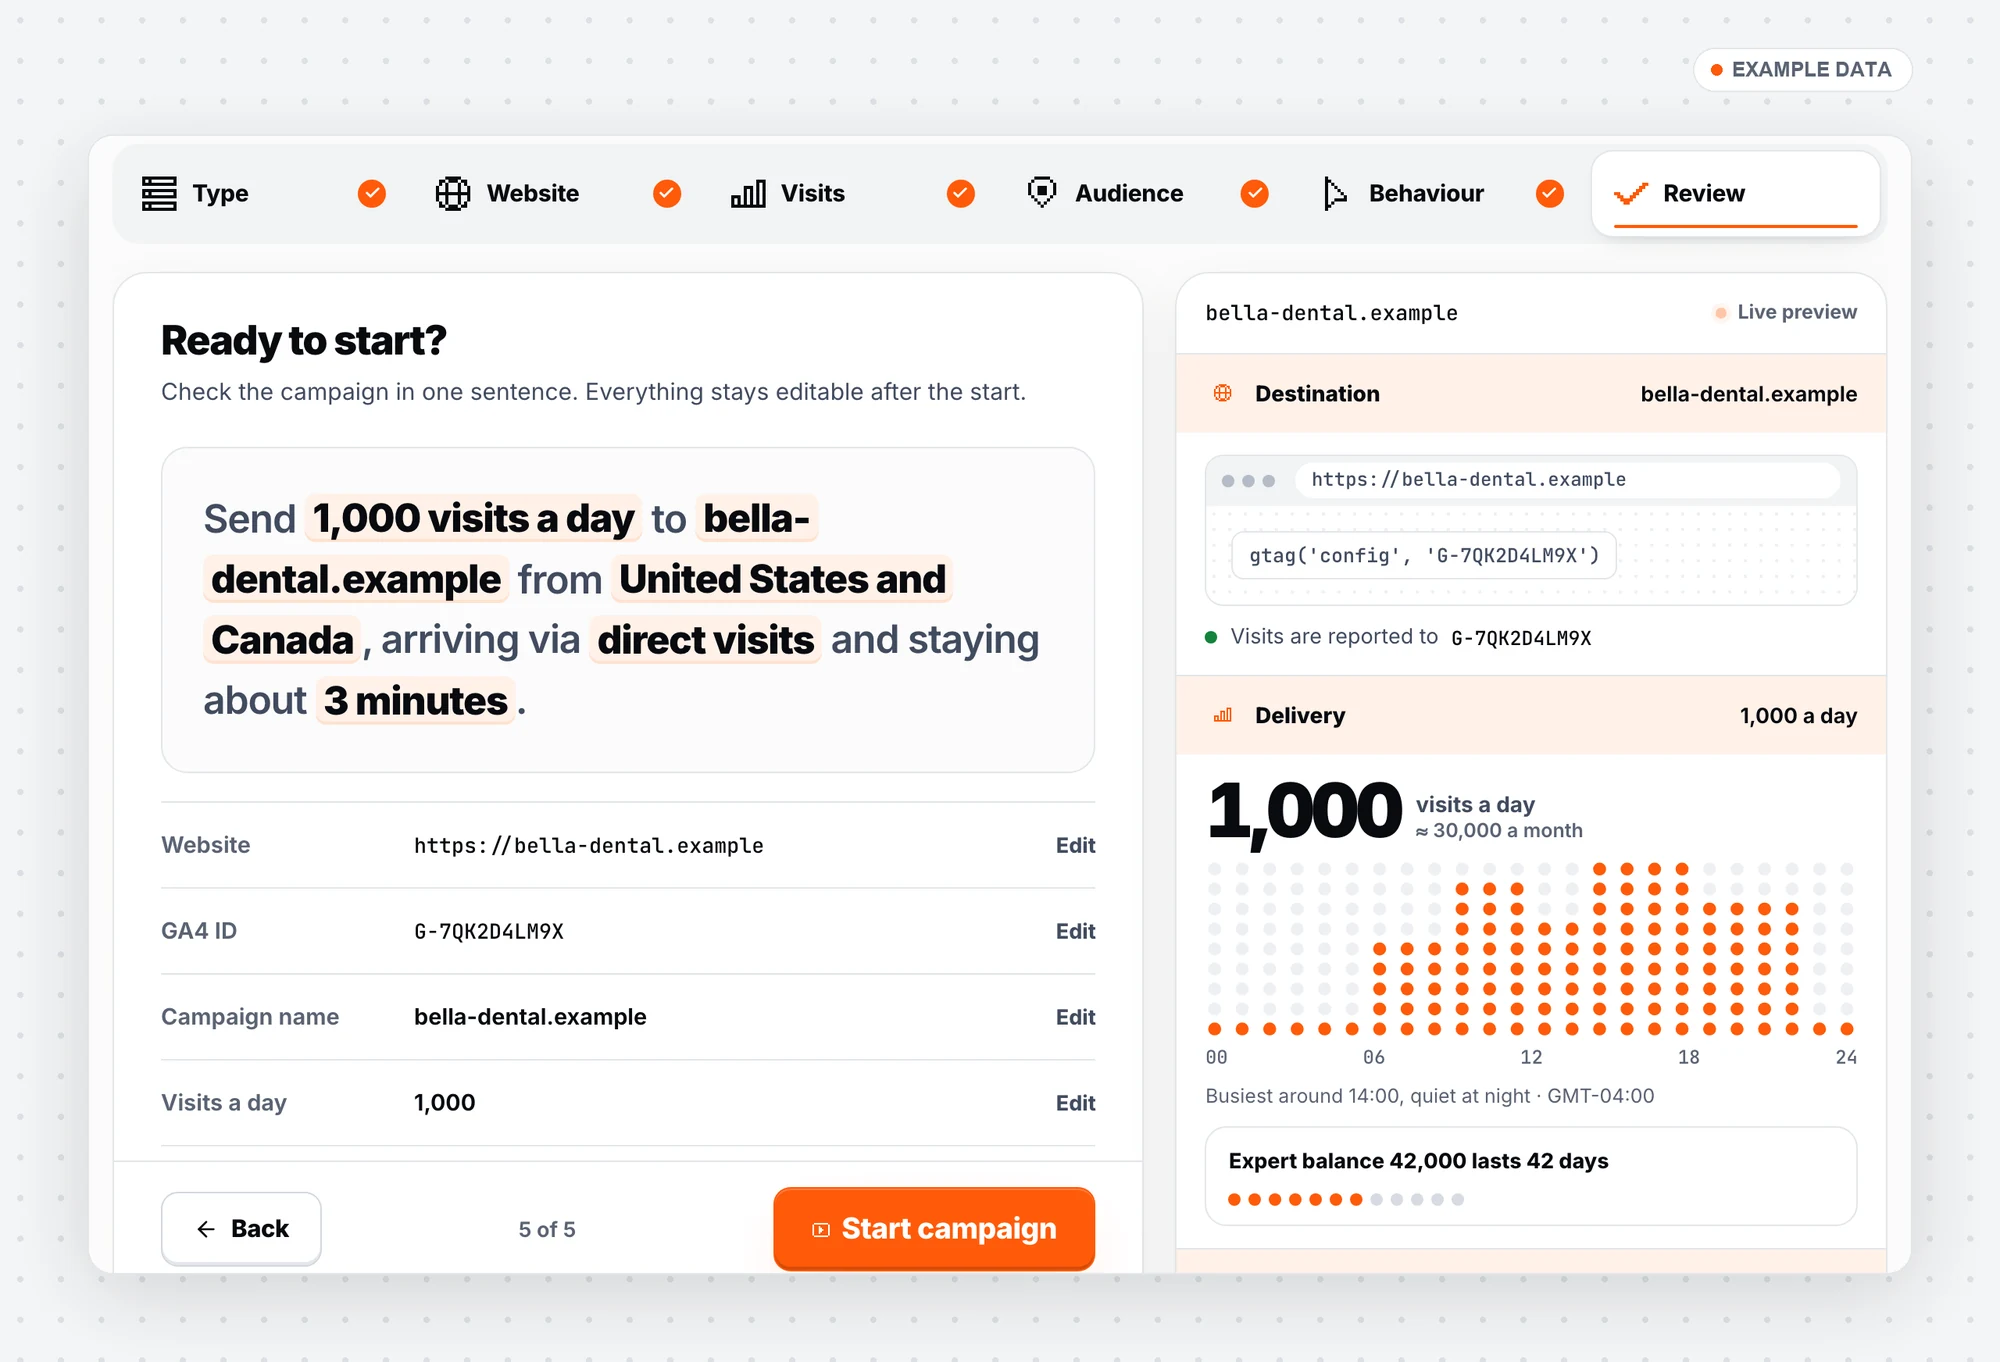
The last step reads the whole campaign back to you in one sentence.
Campaign pages and settings
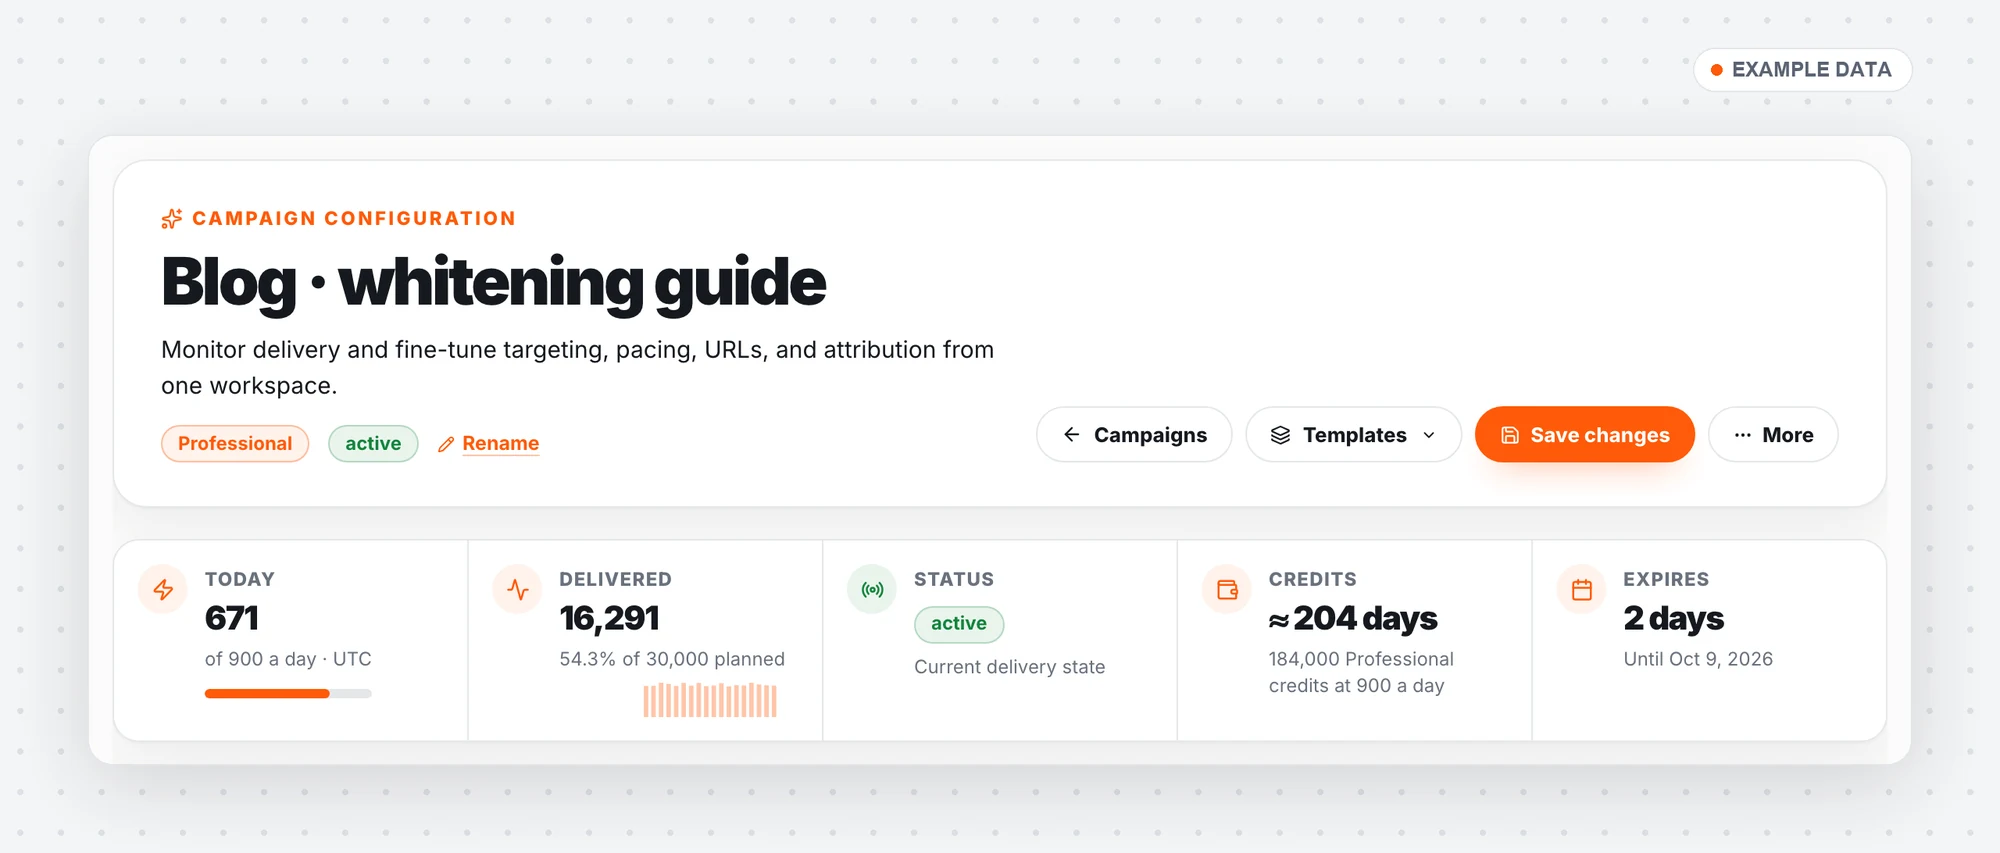
Every campaign opens with today, total delivered, status, how long its credits last and the end date.
- Website campaigns have four numbered sections: Website & tracking, Audience, Behaviour and Schedule.
- A Today tile shows progress against the daily target and the time of the last visit.
- Quick mix sets where your visits come from in one step.
- Behaviour sets time on page, bounce rate and returning visitors, plus scrolling and clicks on the page.
- A save bar tells you when you have unsaved changes, or what still needs fixing, and takes you there.
- Run a campaign for a week, a month, three months, until a set date or with no end. Spread visits evenly or along a natural day curve.
- The campaign list has a Today column and a fix button in each row, for example "Add GA4 ID".
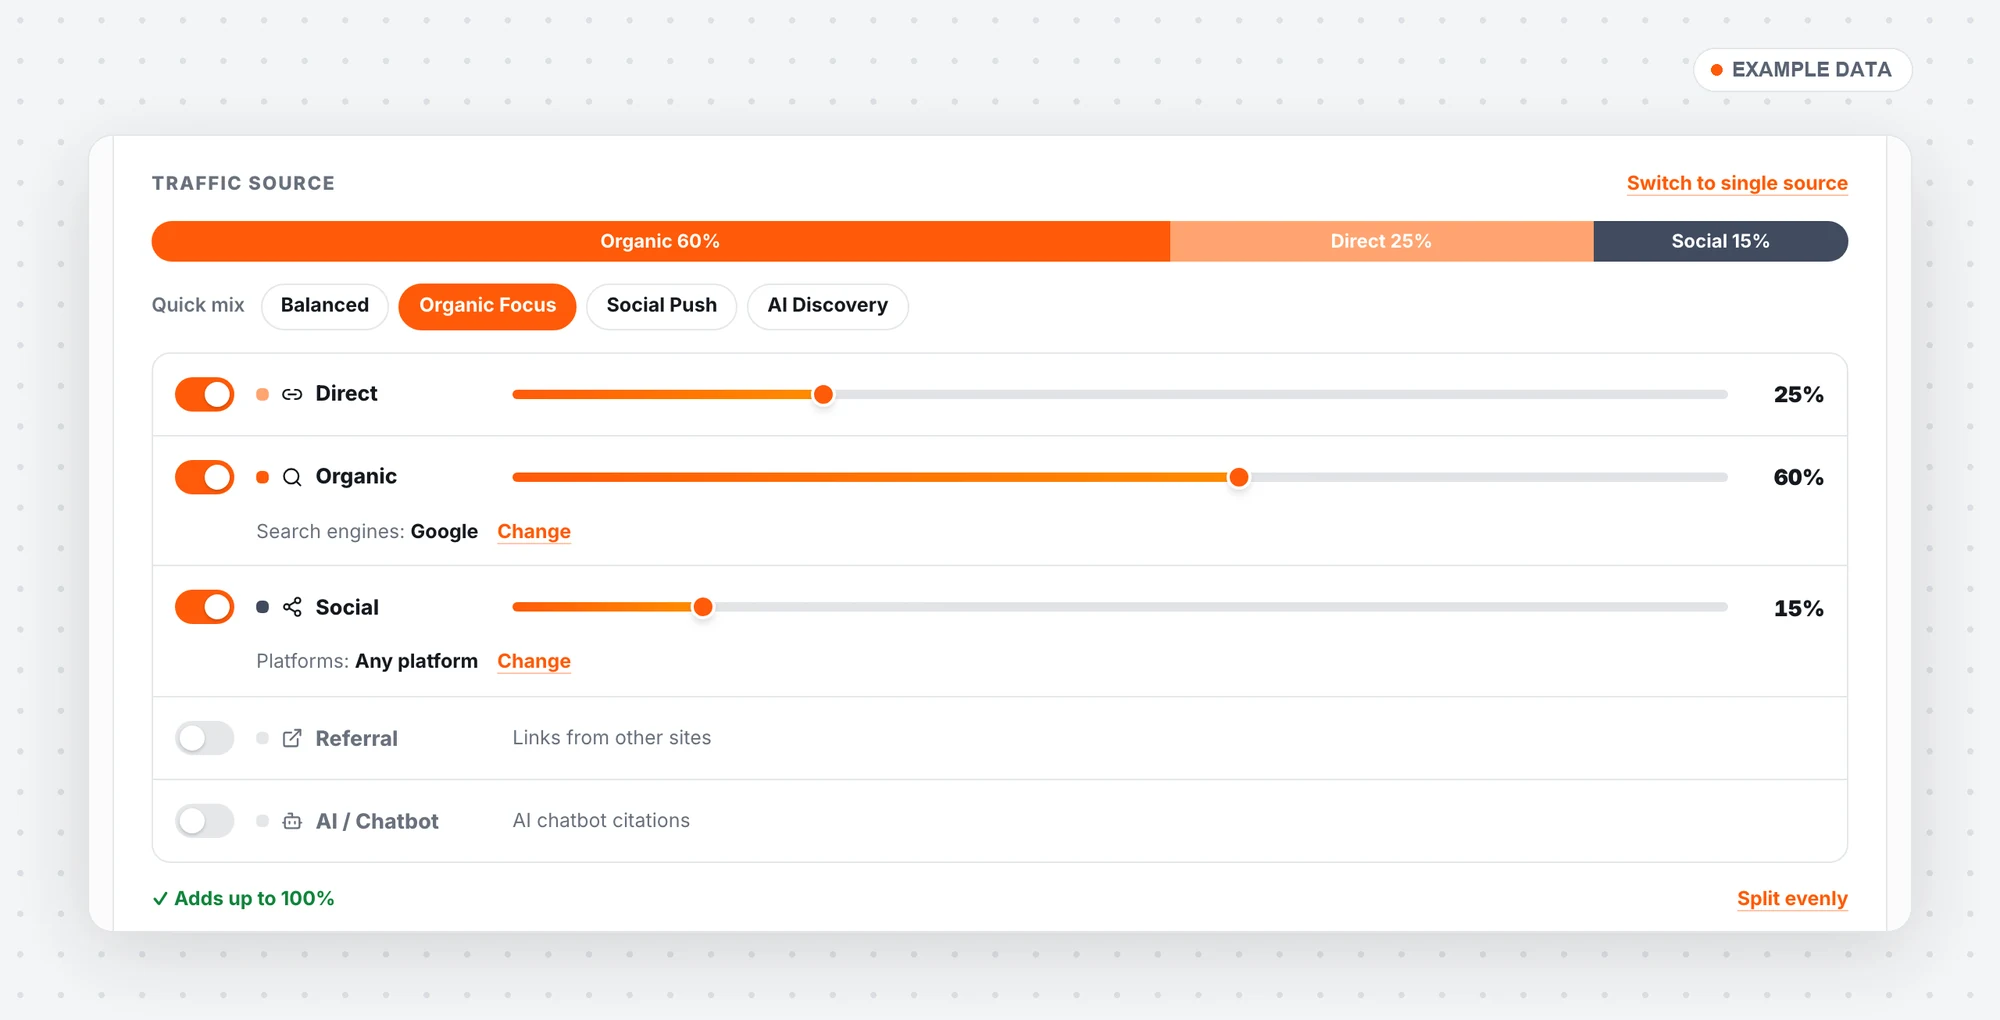
Quick mix and per-source sliders, including AI chatbots and referrals.
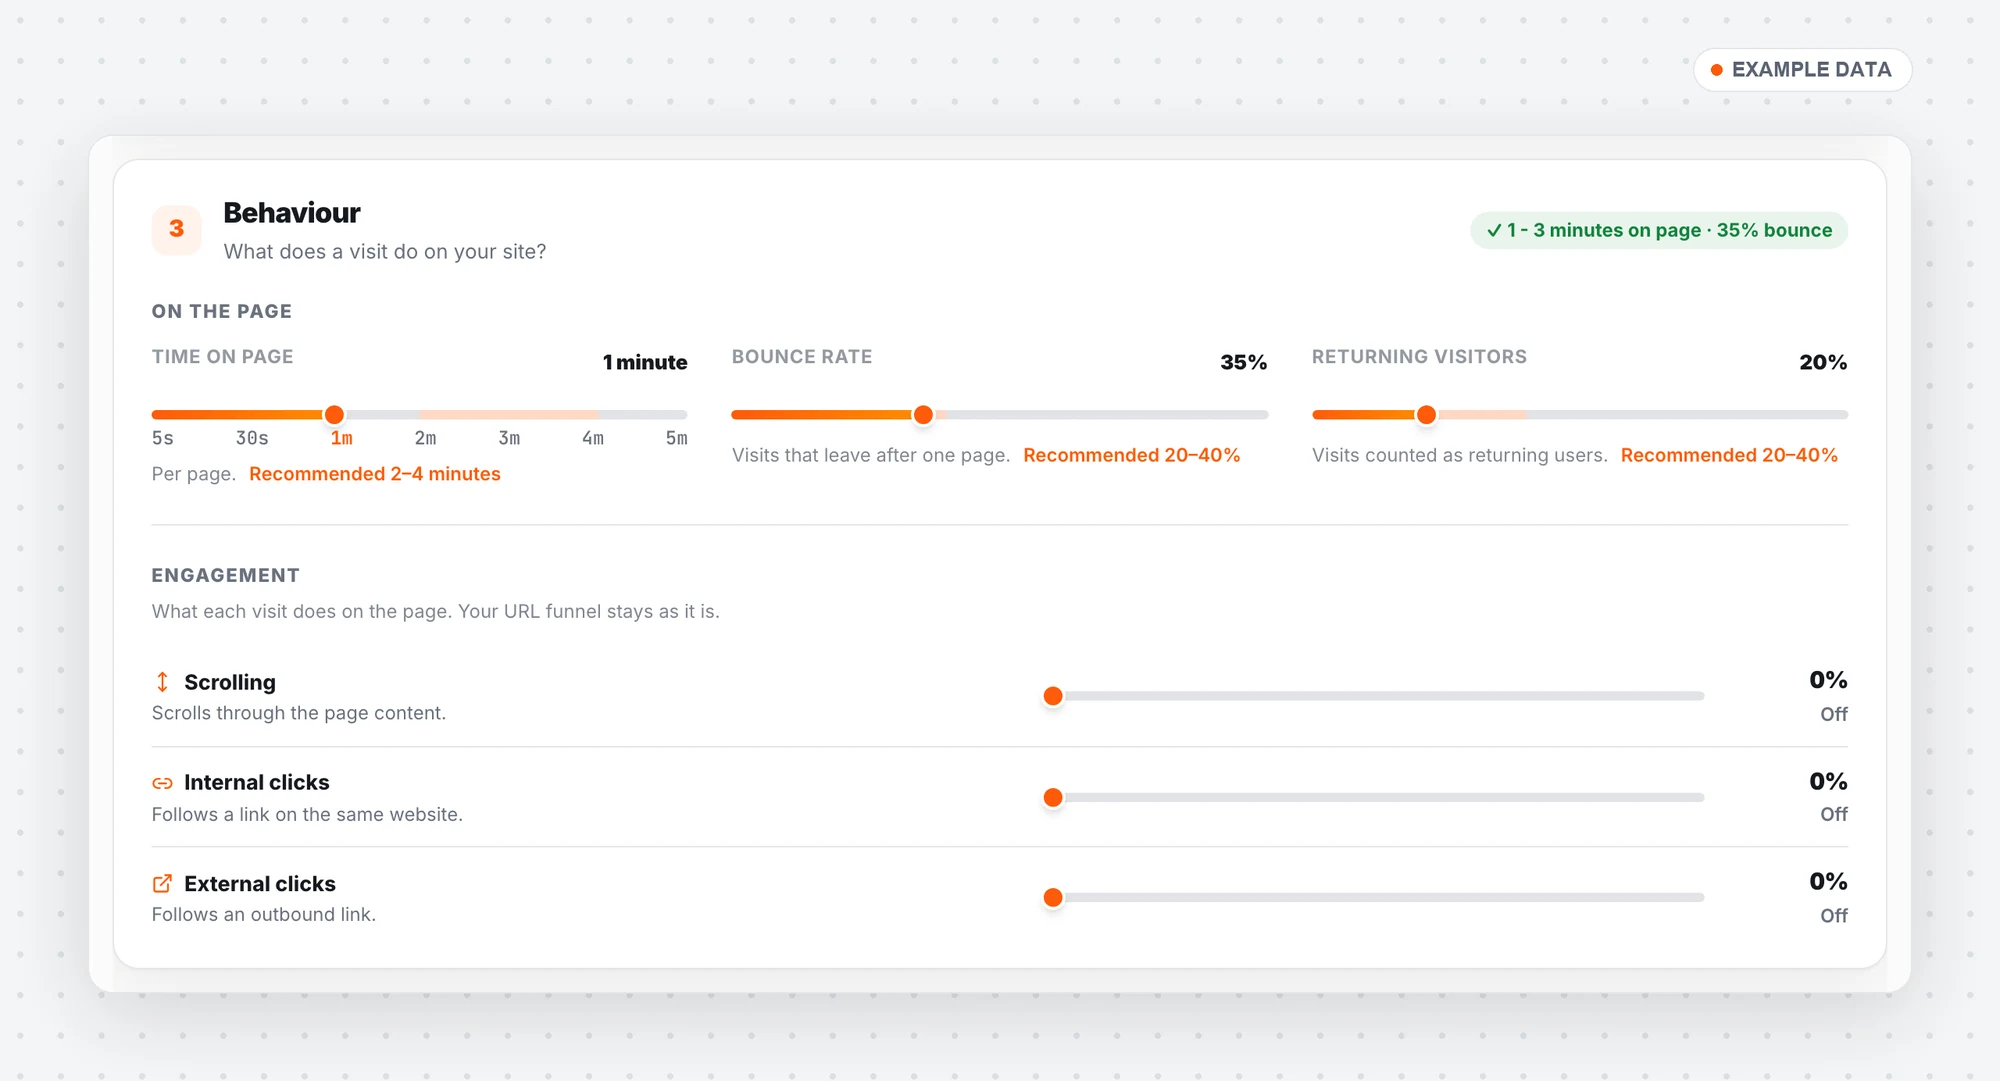
What a visit does on your site: time, bounce rate, returning visitors and engagement.
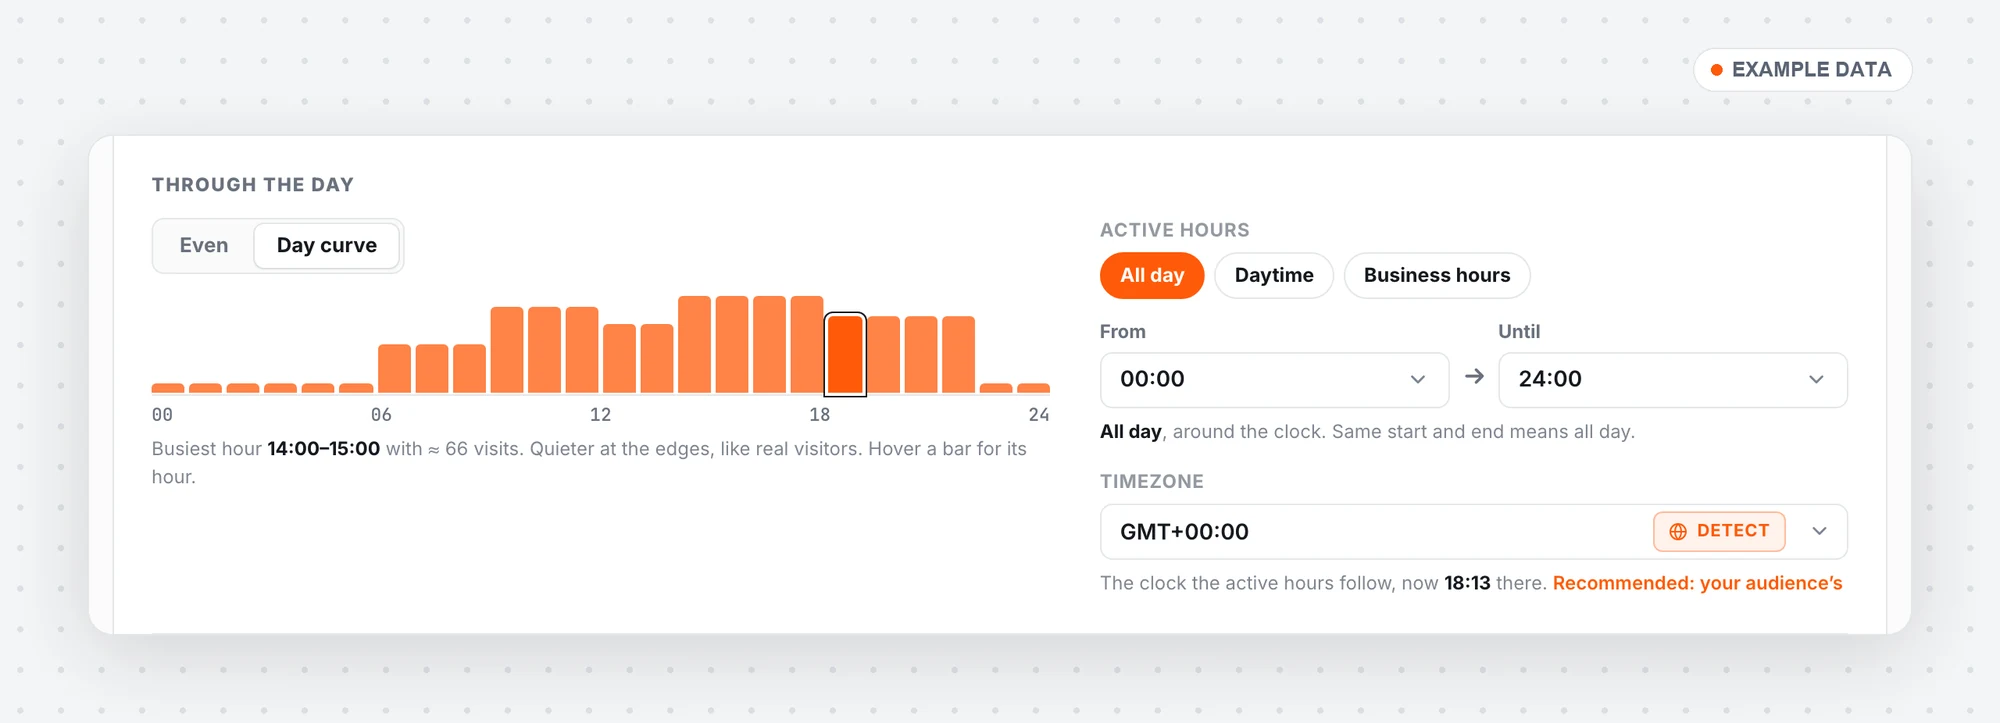
Spread visits along a natural day curve and set active hours in your audience’s time zone.
Search Console and Local SEO campaigns
The GSC Traffic page used to be a sales page. It now shows your actual search campaigns.
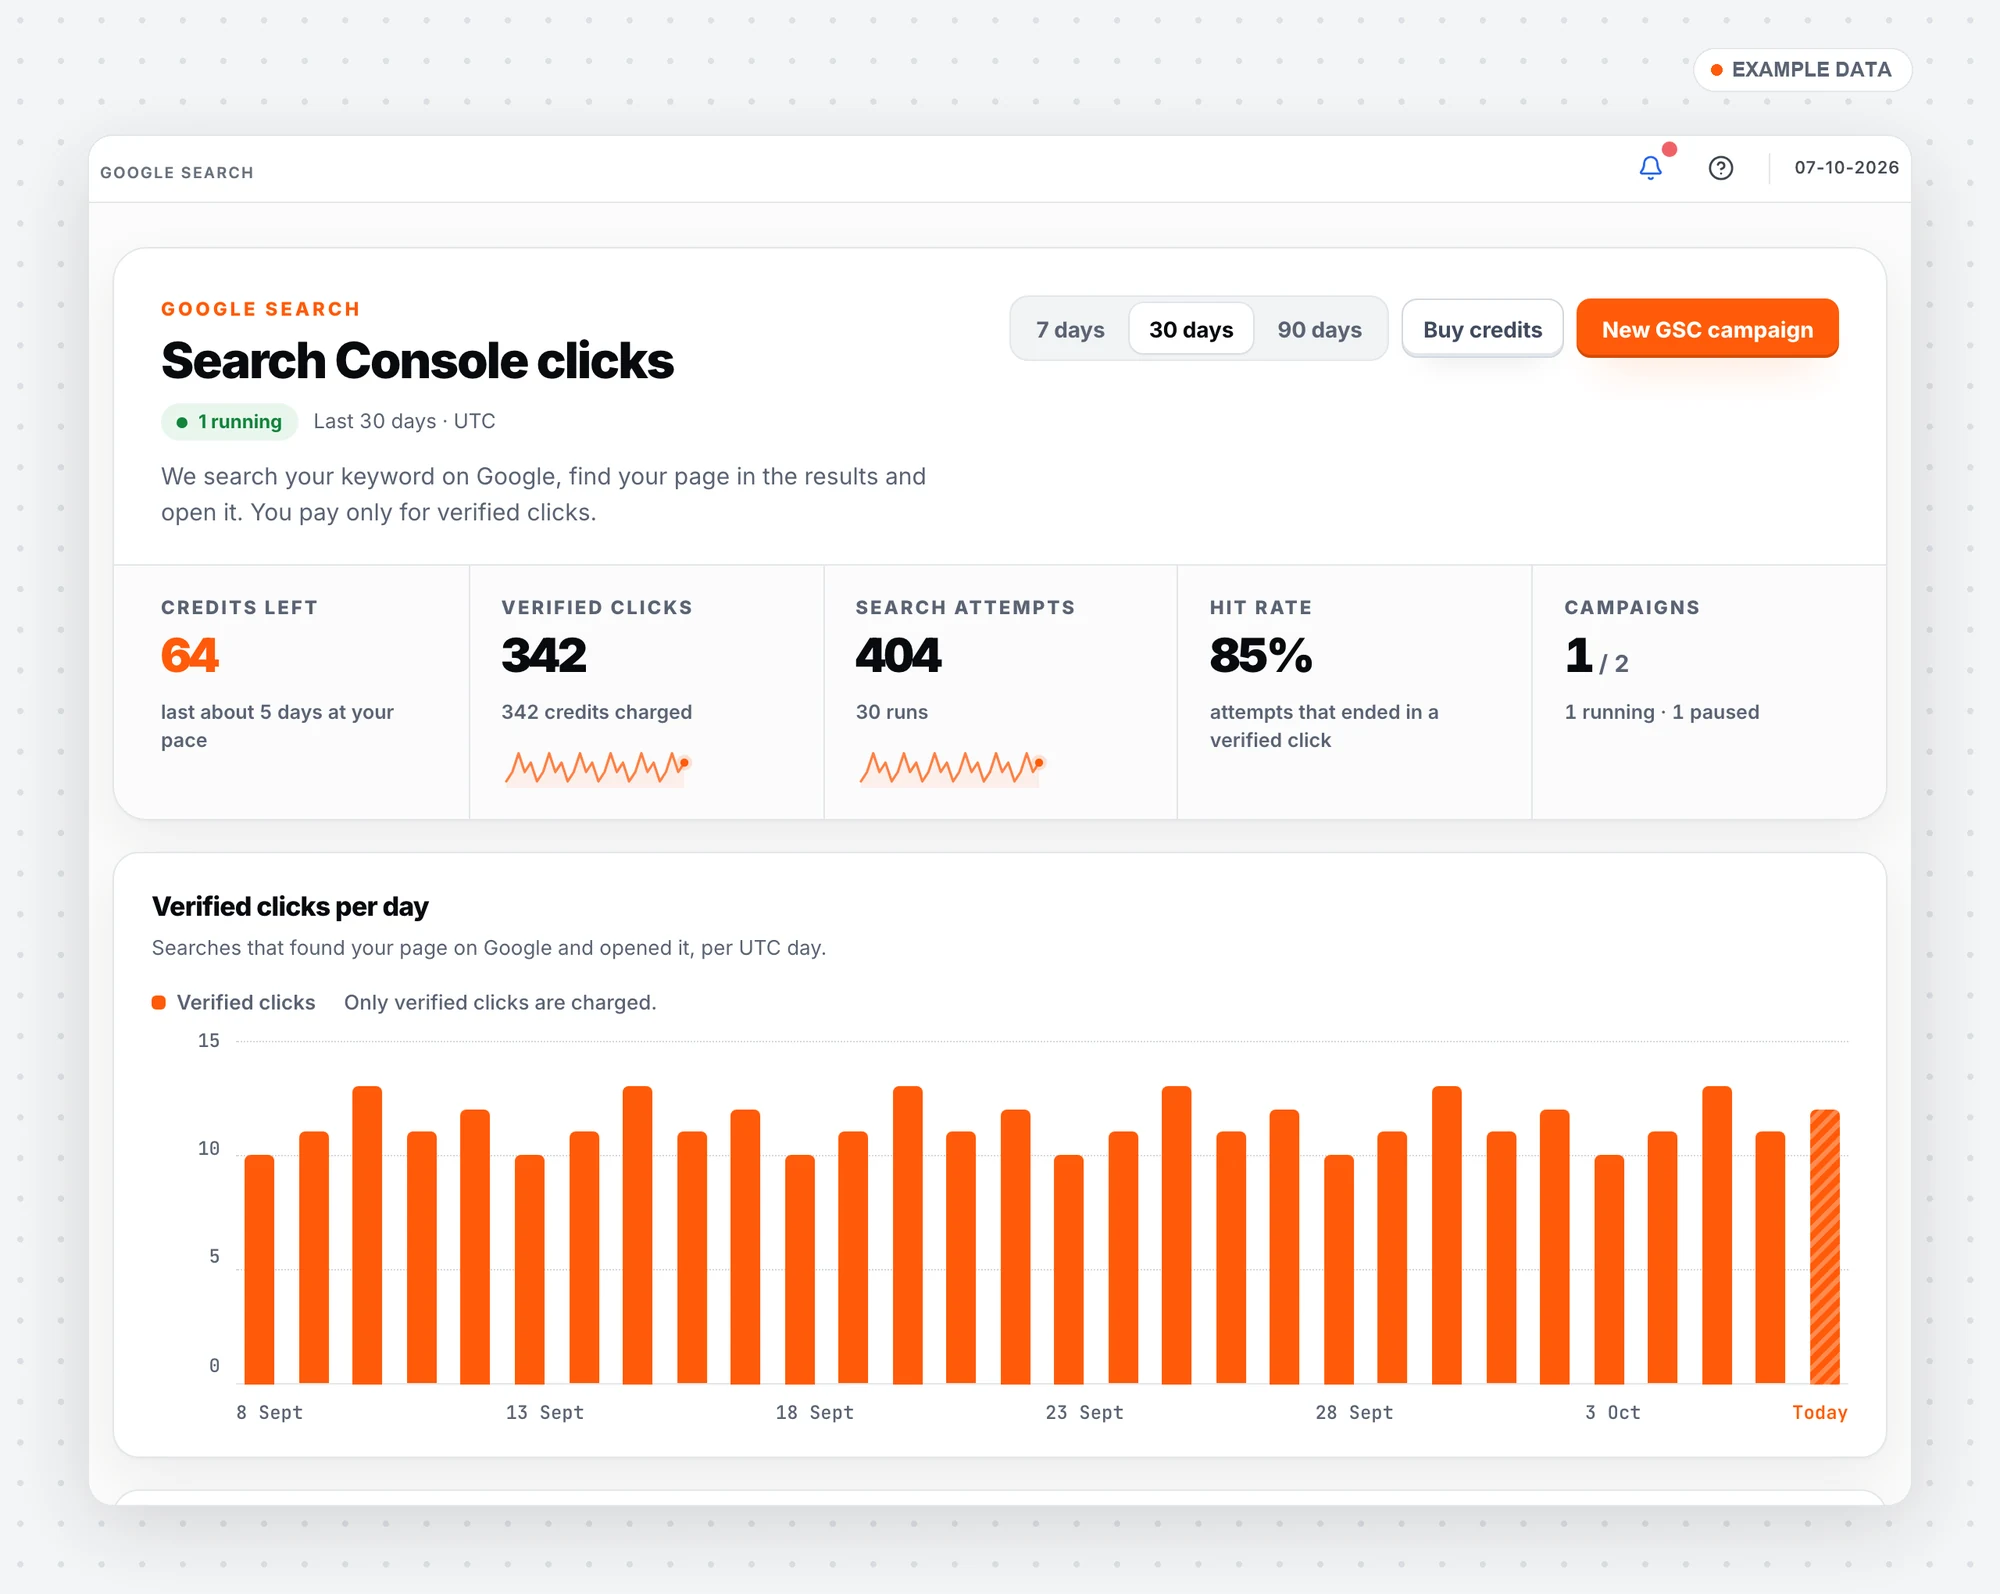
Credits left, verified clicks, search attempts and hit rate, with verified clicks per day.
- See Credits left and how many days they will last, verified clicks per day and your hit rate.
- You pay only for verified clicks: a Google search that found your page and landed on it. A search that fails costs nothing.
- Your page needs to rank somewhere in Google's top 100 for the keyword, so the search can find it.
- The campaign table shows the Google position for each campaign, or tells you when a keyword was not found.
- One campaign can target up to 10 keywords, split by share or by clicks per day, with a table per keyword.
- After the click sets what visitors do on your page: time on page, pages per visit, bounce rate, a goal page and scroll depth.
- Where you were found shows whether a visit came from Google Search or Google Maps, with recent visits.
- Google position is measured once a day for active search campaigns. It is a measurement, not a promise.
- Local SEO campaigns use the same SEO credits and report results from Google Maps.
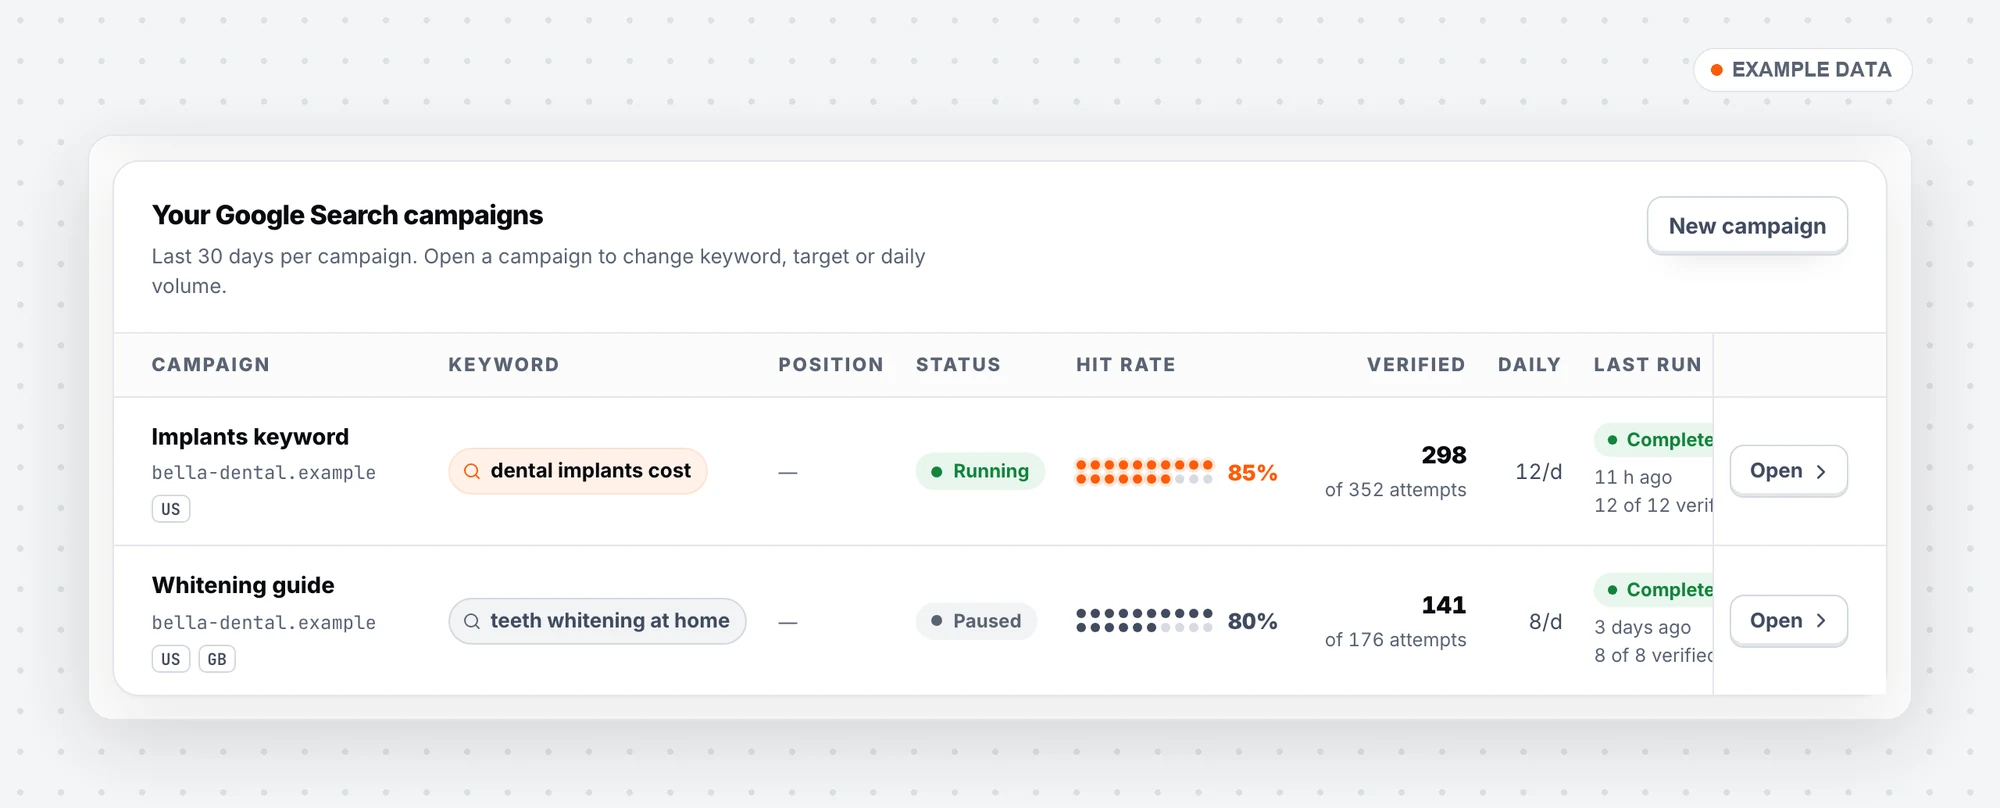
Each search campaign with its keyword, position, status and hit rate.
Search Console usually reports clicks one to two days later. Google decides what it counts, so results and rankings are not guaranteed.
Analytics, out of beta
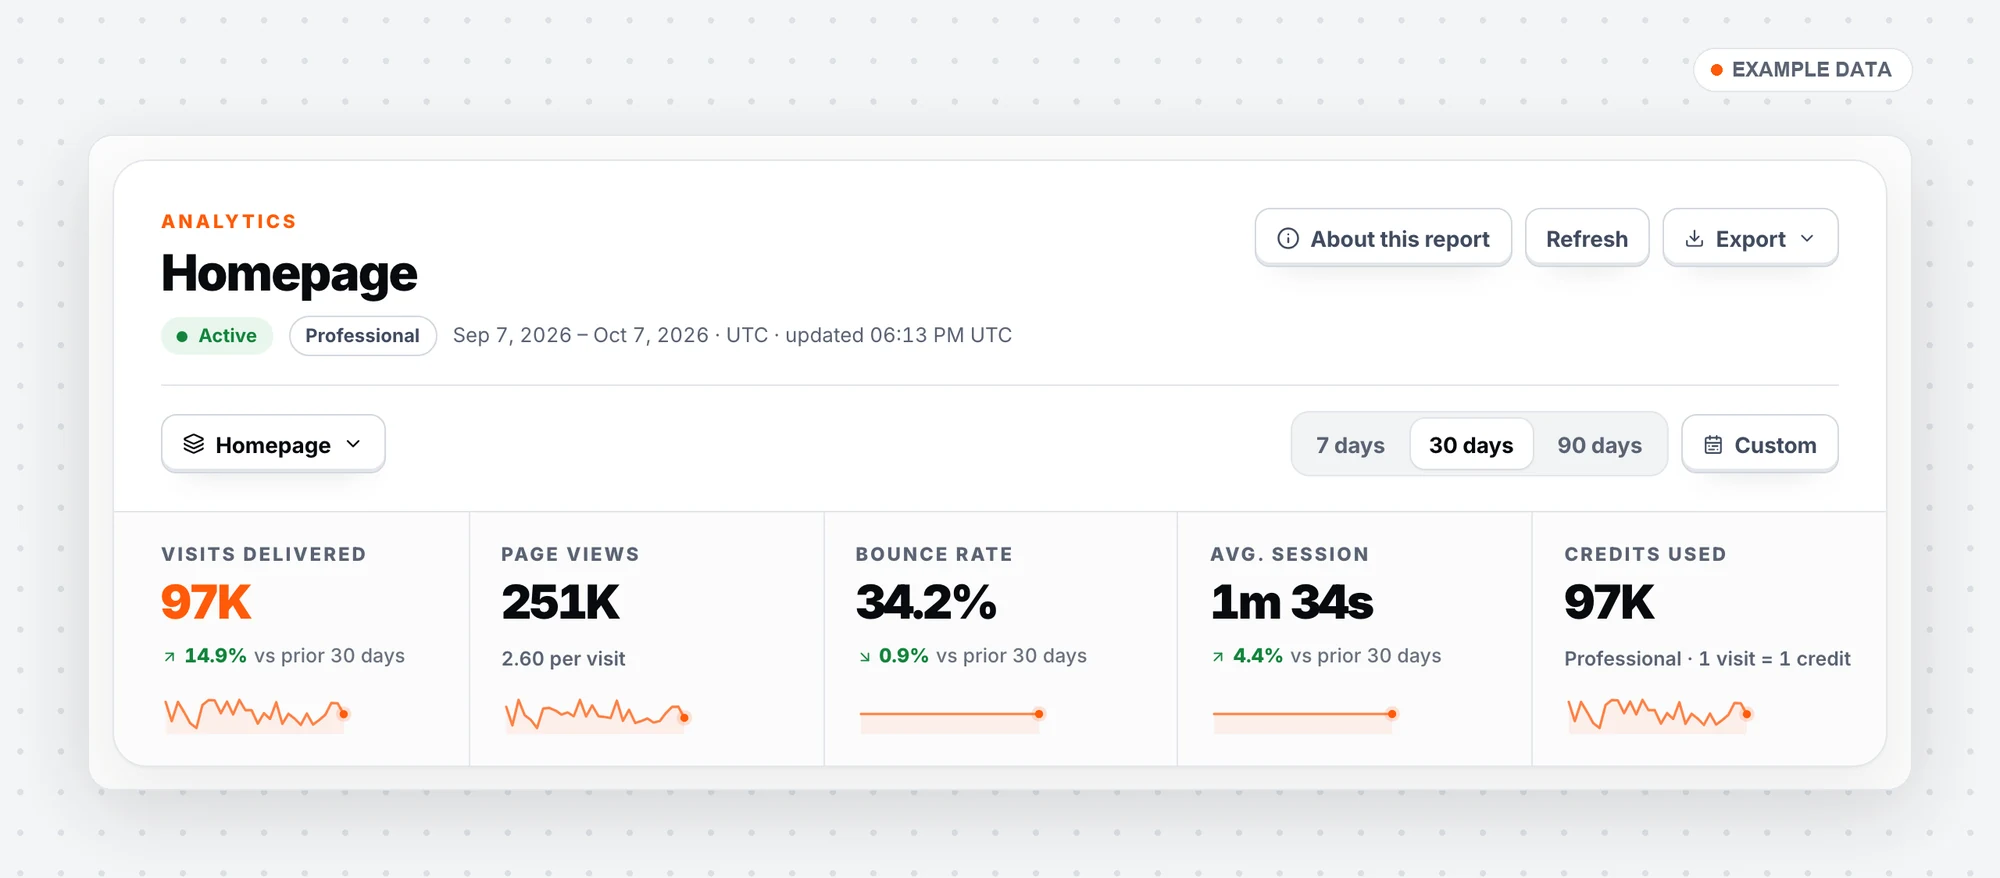
Visits, page views, bounce rate, session time and credits used, each with a trend.
- Analytics has a new design, and the "Alpha" label is gone.
- See visits over time, when visits arrive by hour, how far visitors get, and countries, cities, devices, sources and top pages.
- Verified clicks from your search campaigns now count in Analytics and on the Overview.
- Export your data whenever you need it. Your visits also show up in your own Google Analytics.
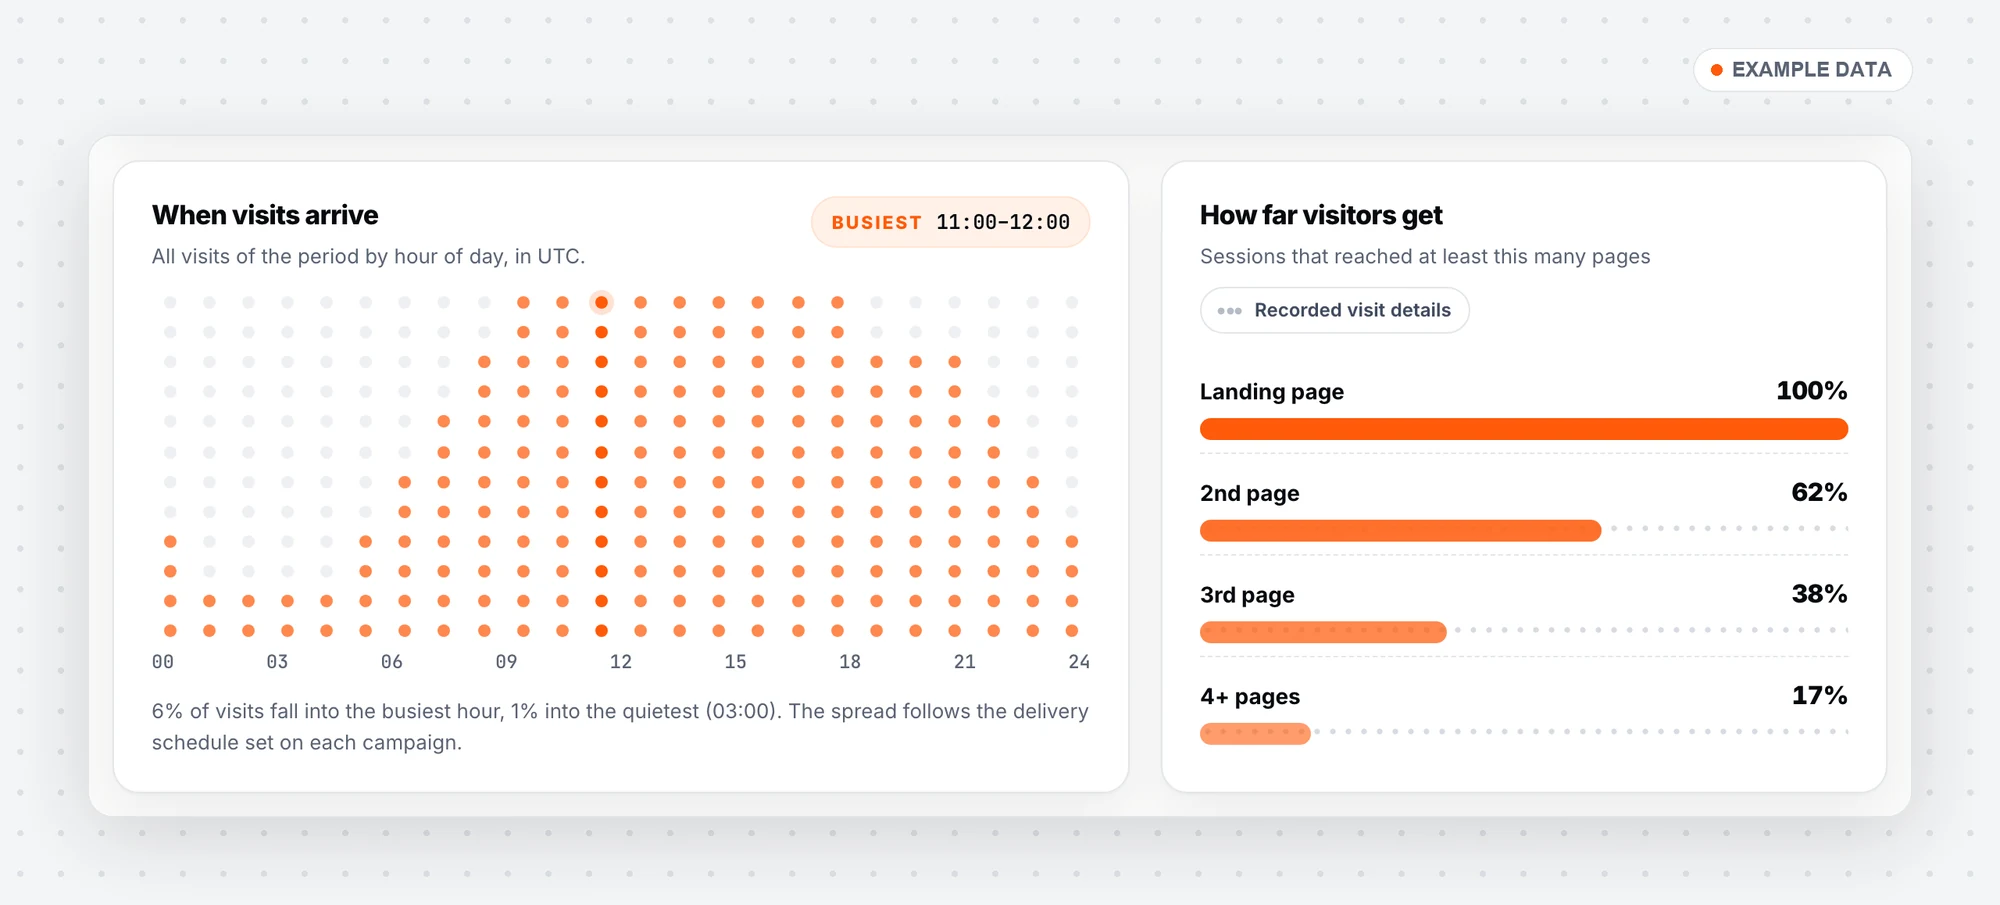
When visits arrive, hour by hour, and how far visitors get through your pages.
Credits, billing and your account
- Credits & Usage shows how long each balance lasts, with a CSV download.
- Billing lists payments in the currency you paid in, and receipts carry your company details.
- Buy credits suggests a pack based on your last 30 days. You can pay by card, crypto or bank transfer.
- Profile shows only controls that work: sign-in history, "Sign out everywhere", a data download and your newsletter setting.
- Accounts with API access manage keys, permissions and IP restrictions in the new Developer API panel.
- Support marks unread replies, refreshes every 30 seconds and has a WhatsApp button.
For agencies: white label is now free
Agencies can resell Traffic Creator under their own brand, with their own prices and no fees. Before setting anything up, Look around first shows example versions of your admin, your customers' dashboard and your shop website.
Works everywhere
- Every page works from a 360-pixel phone screen to a 1920-pixel monitor.
- Dark mode covers every page, with a switch in the sidebar.
- A new loading animation: a visitor dot flies in and lands as the dot on the "i" of our logo.
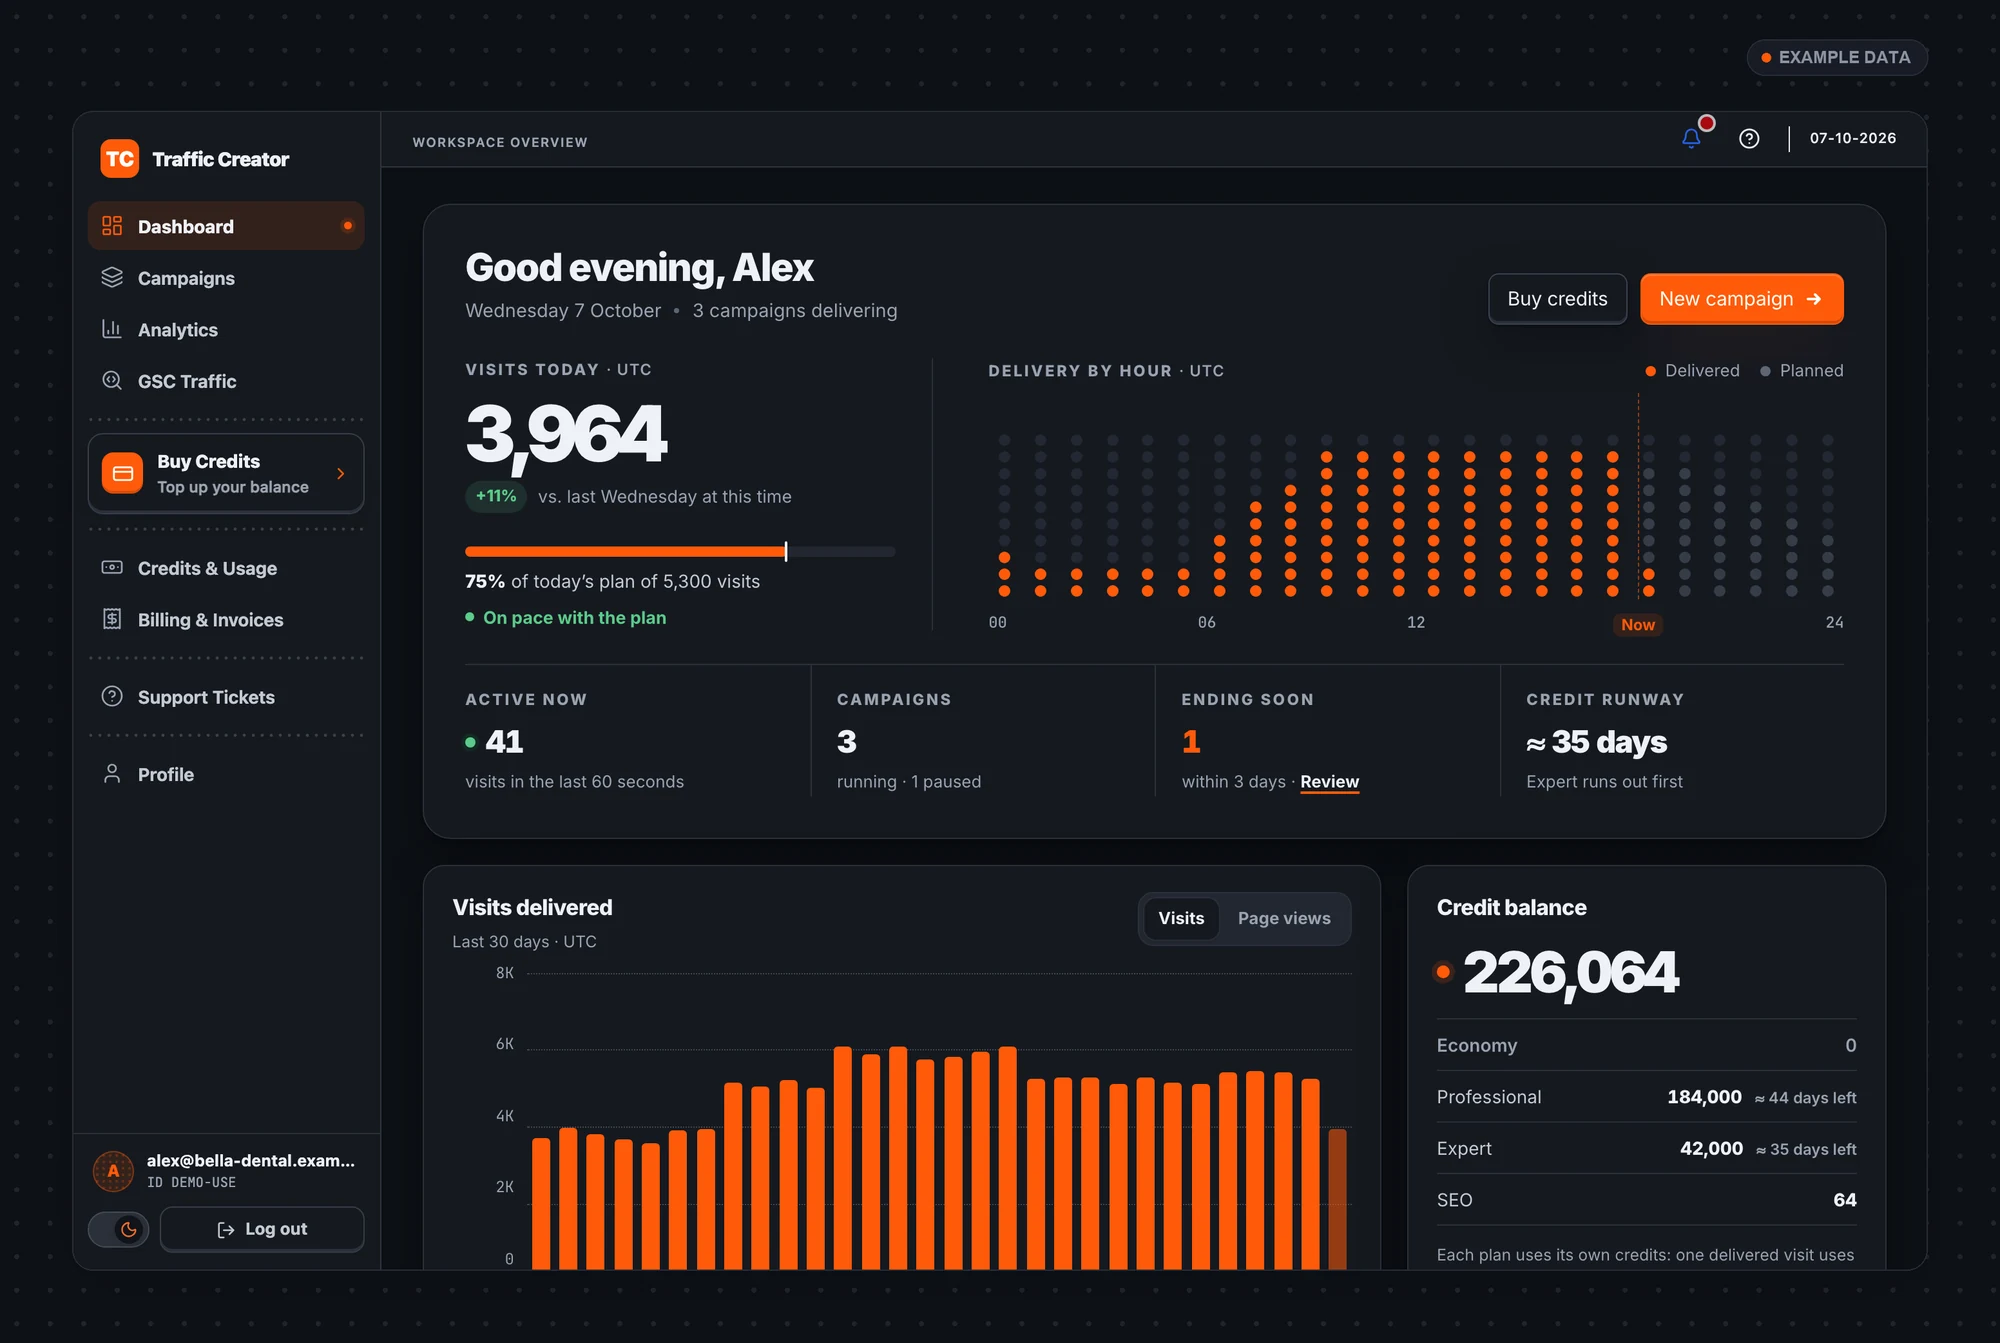
Dark mode on every page.
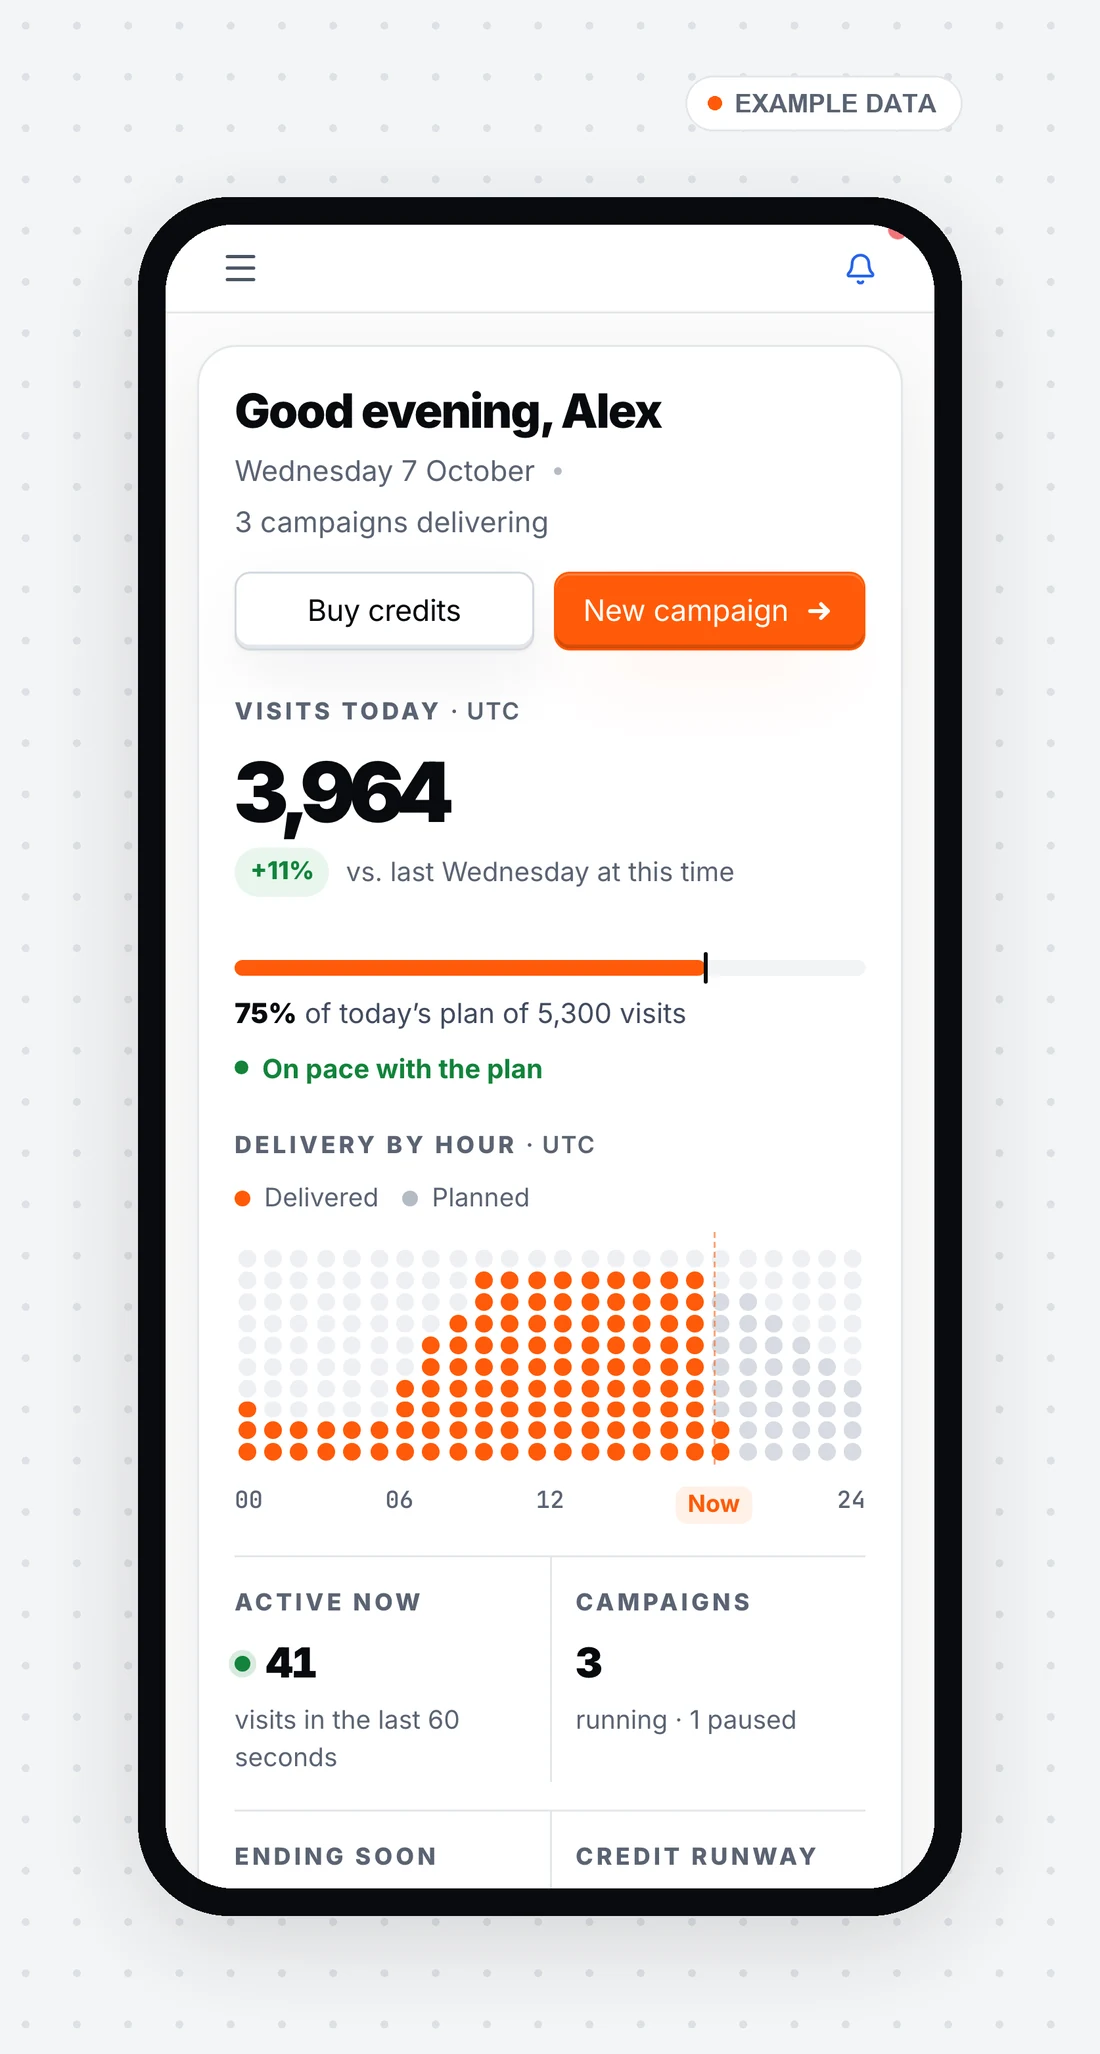
The same overview on a phone.
See it for yourself
Log in at traffic-creator.com/dashboard to see your campaigns in the new design. New to Traffic Creator? Create an account at traffic-creator.com and set up your first campaign.
The screenshots show the dashboard with example data.